Articles - R Graphics Essentials

This book presents the essentials of R graphics systems to create to quickly create beautiful plots using either R base graphs or ggplot2.

You 'll learn:

- How to easily create and customize beautiful graphics using ggplot2 packages and R base functions

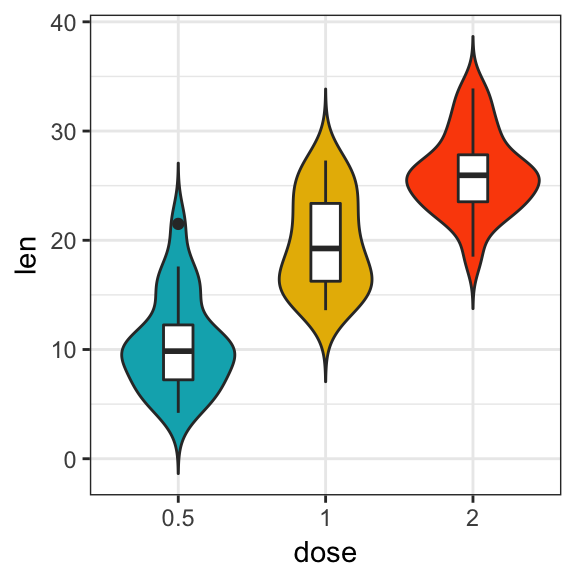
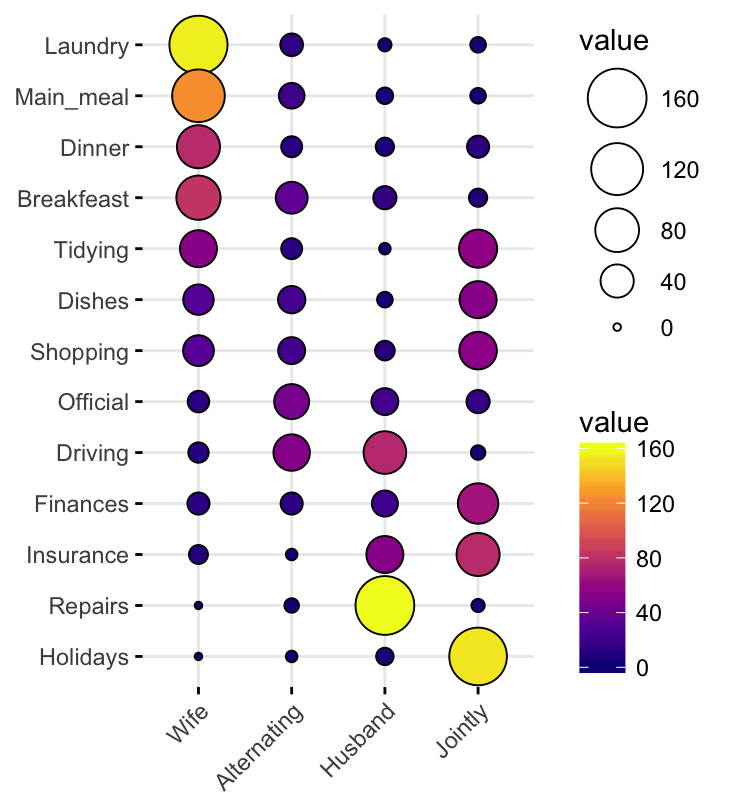
- Type of graphics for visualizing categorical and continuous variables

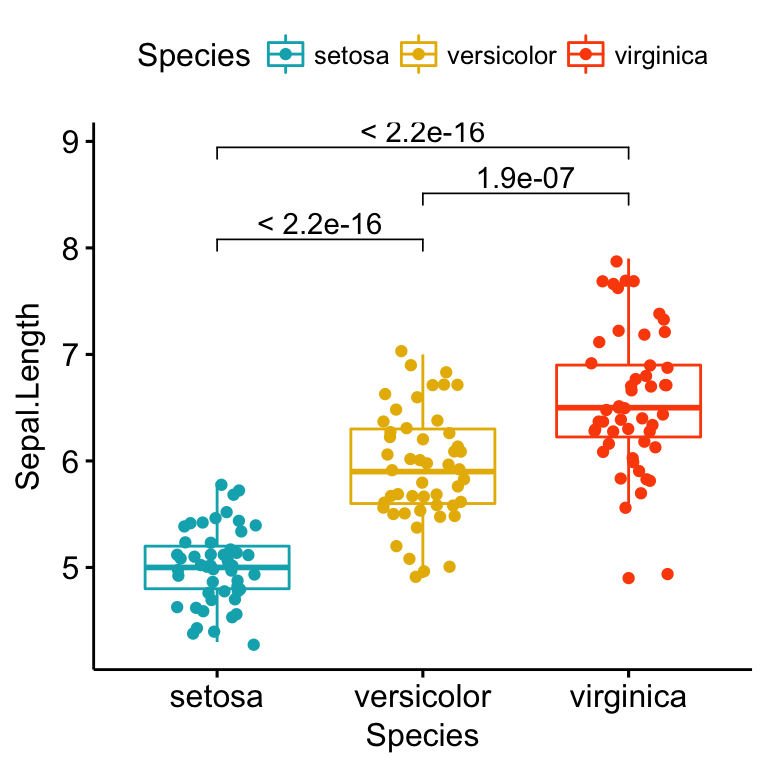
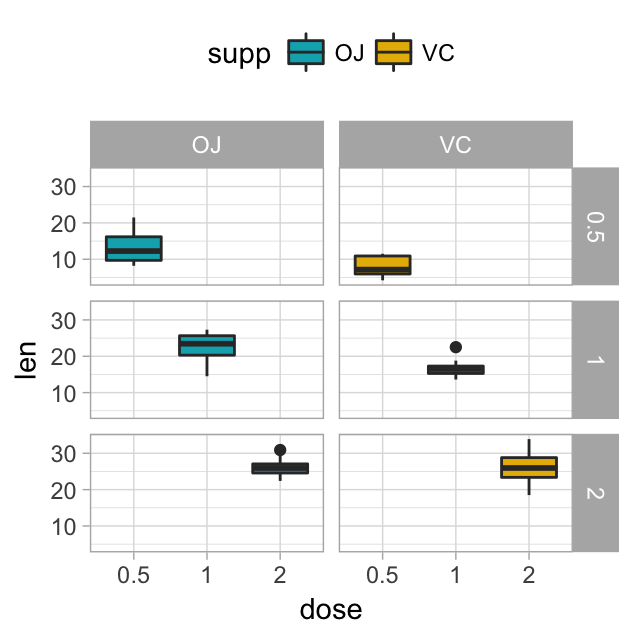
- How to add automatically p-values to box plots, bar plots and alternatives

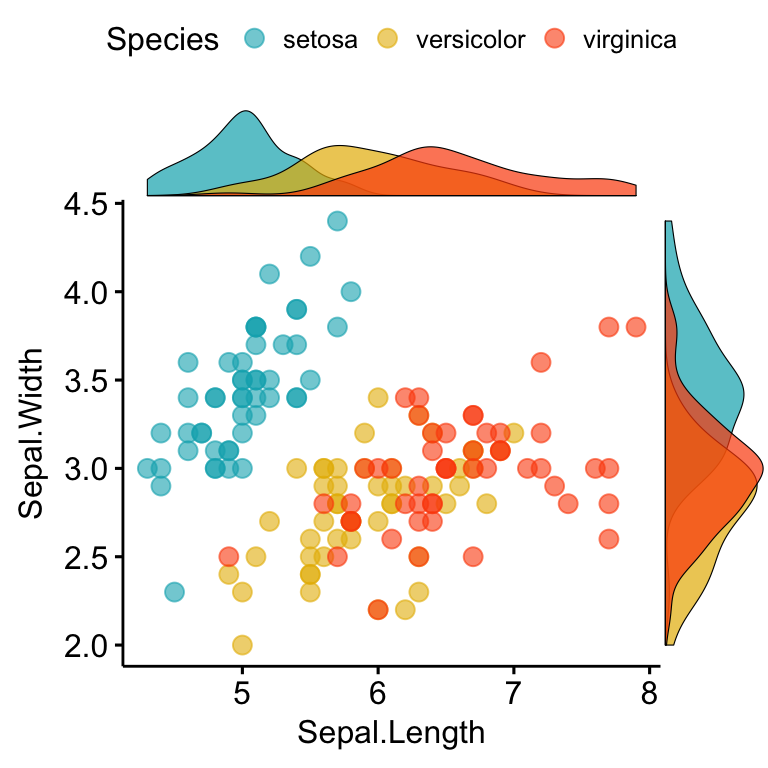
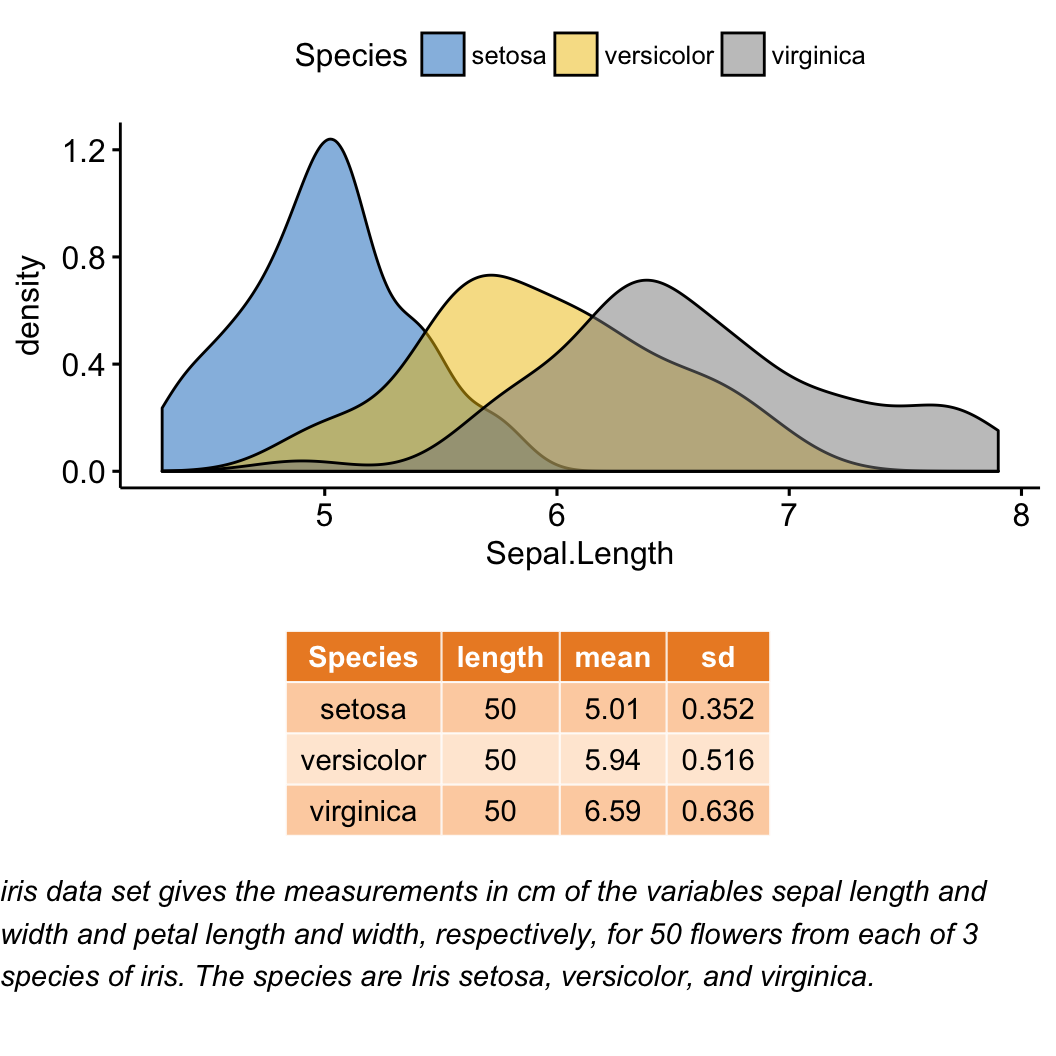
- How to add marginal density plots and correlation coefficients to scatter plots

- Key methods for analyzing and visualizing multivariate data

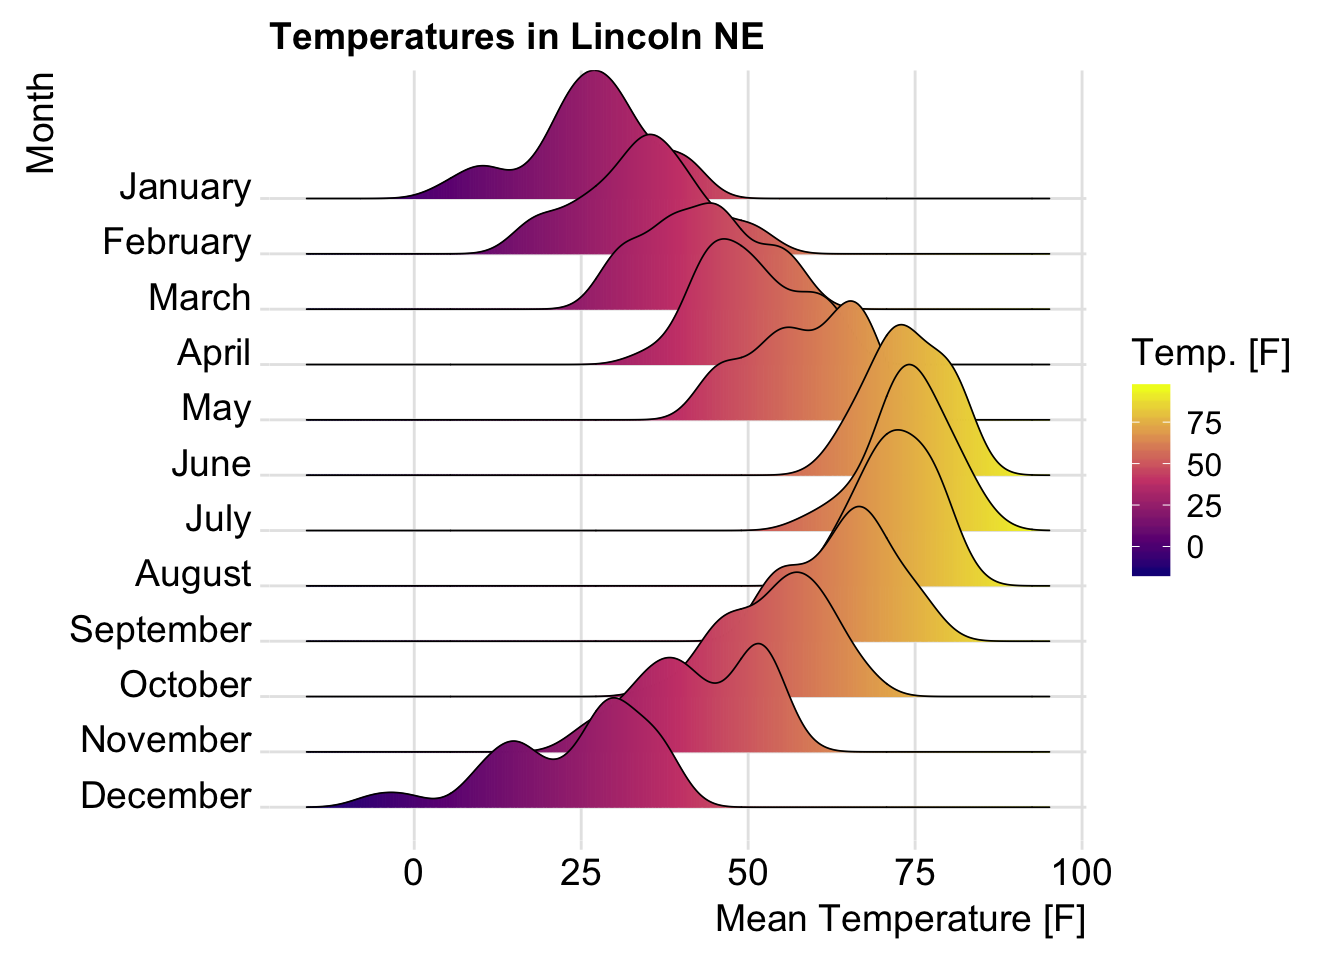
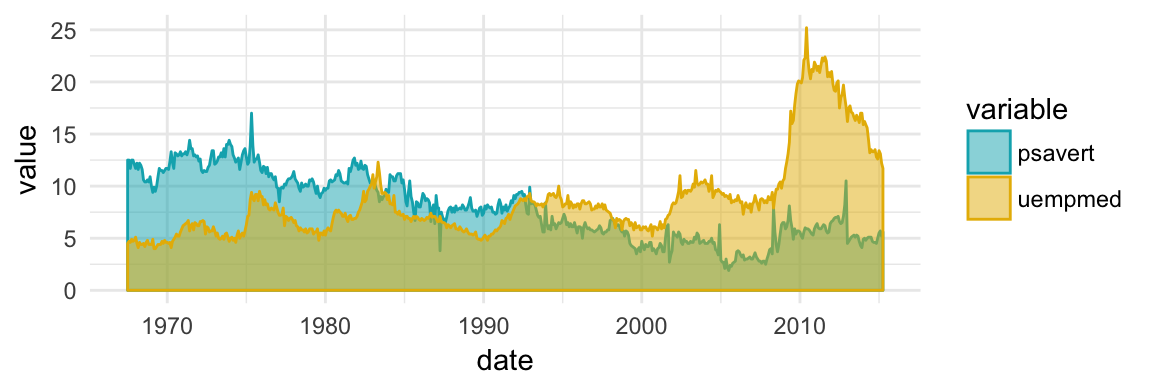
- R functions and packages for plotting time series data

- How to combine multiple plots on one page to create production-quality figures.


Sort by