


Survminer Cheatsheet to Create Easily Survival Plots
We recently released the survminer verion 0.3, which includes many new features to help in visualizing and sumarizing survival analysis results.
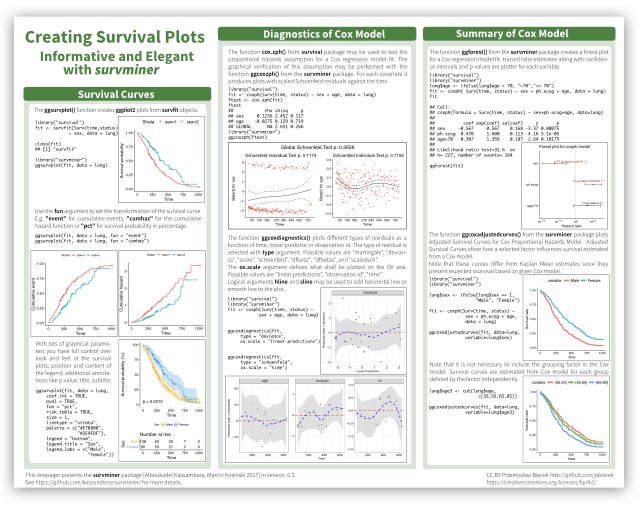
In this article, we present a cheatsheet for survminer, created by Przemysław Biecek, and provide an overview of main functions.
survminer cheatsheet
The cheatsheet can be downloaded from STHDA and from Rstudio. It contains selected important functions, such as:
- ggsurvplot() for plotting survival curves
- ggcoxzph() and ggcoxdiagnostics() for assessing the assumtions of the Cox model
- ggforest() and ggcoxadjustedcurves() for summarizing a Cox model
Additional functions, that you might find helpful, are briefly described in the next section.
survminer overview
The main functions, in the package, are organized in different categories as follow.
Survival Curvesggsurvplot(): Draws survival curves with the ‘number at risk’ table, the cumulative number of events table and the cumulative number of censored subjects table.
arrange_ggsurvplots(): Arranges multiple ggsurvplots on the same page.
ggsurvevents(): Plots the distribution of event’s times.
surv_summary(): Summary of a survival curve. Compared to the default summary() function, surv_summary() creates a data frame containing a nice summary from survfit results.
surv_cutpoint(): Determines the optimal cutpoint for one or multiple continuous variables at once. Provides a value of a cutpoint that correspond to the most significant relation with survival.
pairwise_survdiff(): Multiple comparisons of survival curves. Calculate pairwise comparisons between group levels with corrections for multiple testing.
ggcoxzph(): Graphical test of proportional hazards. Displays a graph of the scaled Schoenfeld residuals, along with a smooth curve using ggplot2. Wrapper around plot.cox.zph().
ggcoxdiagnostics(): Displays diagnostics graphs presenting goodness of Cox Proportional Hazards Model fit.
ggcoxfunctional(): Displays graphs of continuous explanatory variable against martingale residuals of null cox proportional hazards model. It helps to properly choose the functional form of continuous variable in cox model.
ggforest(): Draws forest plot for CoxPH model.
ggcoxadjustedcurves(): Plots adjusted survival curves for coxph model.
- ggcompetingrisks(): Plots cumulative incidence curves for competing risks.
Find out more at https://www.sthda.com/english/rpkgs/survminer/, and check out the documentation and usage examples of each of the functions in survminer package.
Infos
This analysis has been performed using R software (ver. 3.3.2).
Show me some love with the like buttons below... Thank you and please don't forget to share and comment below!!
Montrez-moi un peu d'amour avec les like ci-dessous ... Merci et n'oubliez pas, s'il vous plaît, de partager et de commenter ci-dessous!
Recommended for You!


Recommended for you
This section contains the best data science and self-development resources to help you on your path.
Books - Data Science
Our Books
- Practical Guide to Cluster Analysis in R by A. Kassambara (Datanovia)
- Practical Guide To Principal Component Methods in R by A. Kassambara (Datanovia)
- Machine Learning Essentials: Practical Guide in R by A. Kassambara (Datanovia)
- R Graphics Essentials for Great Data Visualization by A. Kassambara (Datanovia)
- GGPlot2 Essentials for Great Data Visualization in R by A. Kassambara (Datanovia)
- Network Analysis and Visualization in R by A. Kassambara (Datanovia)
- Practical Statistics in R for Comparing Groups: Numerical Variables by A. Kassambara (Datanovia)
- Inter-Rater Reliability Essentials: Practical Guide in R by A. Kassambara (Datanovia)
Others
- R for Data Science: Import, Tidy, Transform, Visualize, and Model Data by Hadley Wickham & Garrett Grolemund
- Hands-On Machine Learning with Scikit-Learn, Keras, and TensorFlow: Concepts, Tools, and Techniques to Build Intelligent Systems by Aurelien Géron
- Practical Statistics for Data Scientists: 50 Essential Concepts by Peter Bruce & Andrew Bruce
- Hands-On Programming with R: Write Your Own Functions And Simulations by Garrett Grolemund & Hadley Wickham
- An Introduction to Statistical Learning: with Applications in R by Gareth James et al.
- Deep Learning with R by François Chollet & J.J. Allaire
- Deep Learning with Python by François Chollet
Click to follow us on Facebook :
Comment this article by clicking on "Discussion" button (top-right position of this page)