


GGPlot Facet: Quick Reference
This chapter provides a quick reference to facet_wrap() and facet_grid() for faceting a ggplot into multiple panels.
Facets divide a ggplot into subplots based on the values of one or more categorical variables. There are two main functions for faceting:
facet_grid(), which layouts panels in a grid. It creates a matrix of panels defined by row and column faceting variablesfacet_wrap(), which wraps a 1d sequence of panels into 2d. This is generally a better use of screen space than facet_grid() because most displays are roughly rectangular.
Here, you’ll learn how to:
- Create a facet wrap and facet grid panels.
- Make the scales of facets free (independent).
- Change facet labels text and appearance.
Contents:

Prerequisites
Load required packages and set the theme function theme_light() [ggplot2] as the default theme:
library(ggplot2)
theme_set(
  theme_light() + theme(legend.position = "top")
  )
Create a box plot filled by groups:
# Load data and convert dose to a factor variable
data("ToothGrowth")
ToothGrowth$dose <- as.factor(ToothGrowth$dose)
# Box plot
p <- ggplot(ToothGrowth, aes(x = dose, y = len)) +
  geom_boxplot(aes(fill = supp), position = position_dodge(0.9)) +
  scale_fill_manual(values = c("#00AFBB", "#E7B800"))
p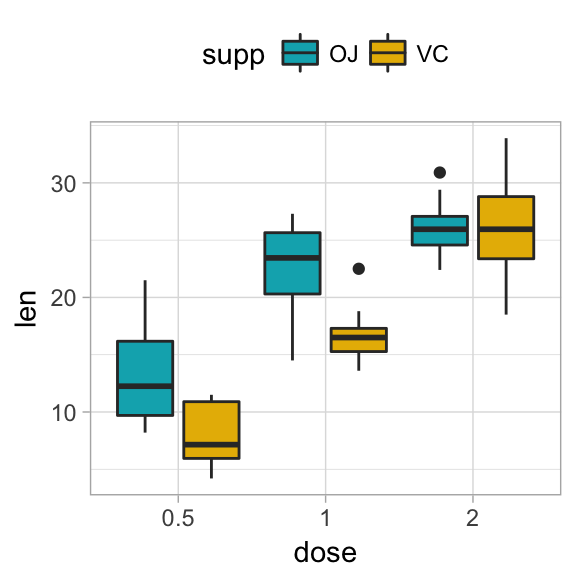
Key R functions: facet_grid and facet_wrap
The following functions can be used for facets:
- p + facet_grid(supp ~ .): Facet in vertical direction based on the levels of supp variable.
- p + facet_grid(. ~ supp): Facet in horizontal direction based on the levels of supp variable.
- p + facet_grid(dose ~ supp): Facet in horizontal and vertical directions based on two variables: dose and supp.
- p + facet_wrap(~ fl): Place facet side by side into a rectangular layout
Using facet_grid
- Facet with one discrete variable. Split by the levels of the group “supp”
# Split in vertical direction
p + facet_grid(supp ~ .)
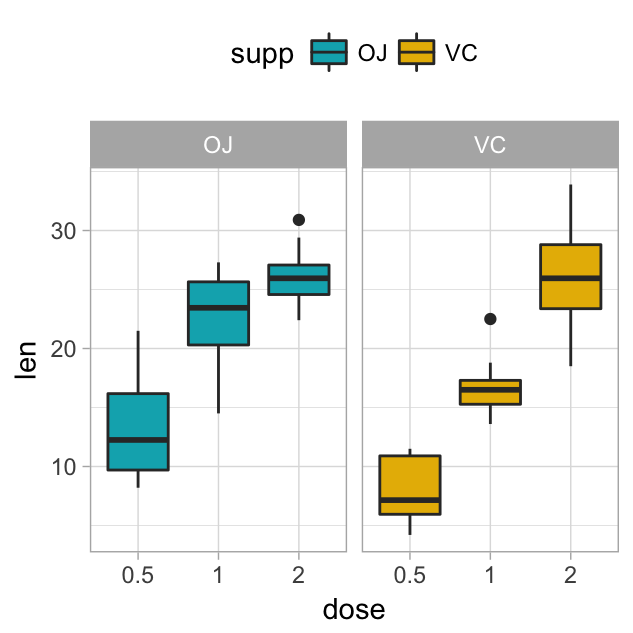
# Split in horizontal direction
p + facet_grid(. ~ supp)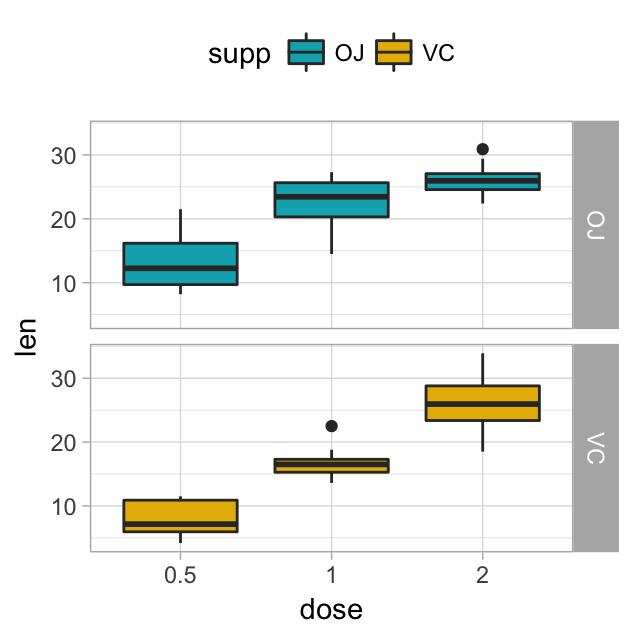
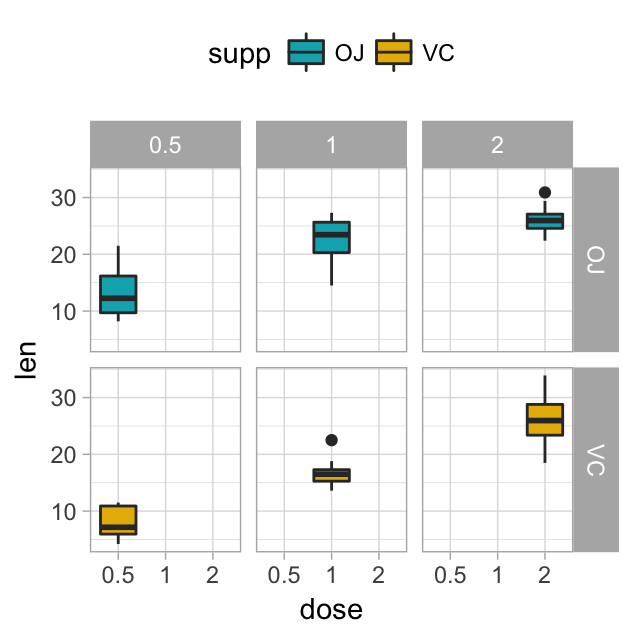
- Facet with multiple variables. Split by the levels of two grouping variables: “dose” and “supp”
# Facet by two variables: dose and supp.
# Rows are dose and columns are supp
p + facet_grid(dose ~ supp)
# Facet by two variables: reverse the order of the 2 variables
# Rows are supp and columns are dose
p + facet_grid(supp ~ dose)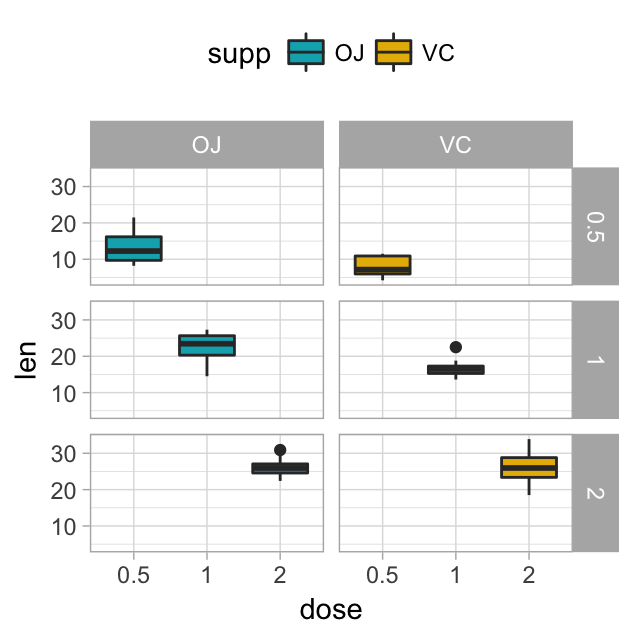
Note that, you can use the argument margins to add additional facets which contain all the data for each of the possible values of the faceting variables
p + facet_grid(dose ~ supp, margins=TRUE)Using facet_wrap
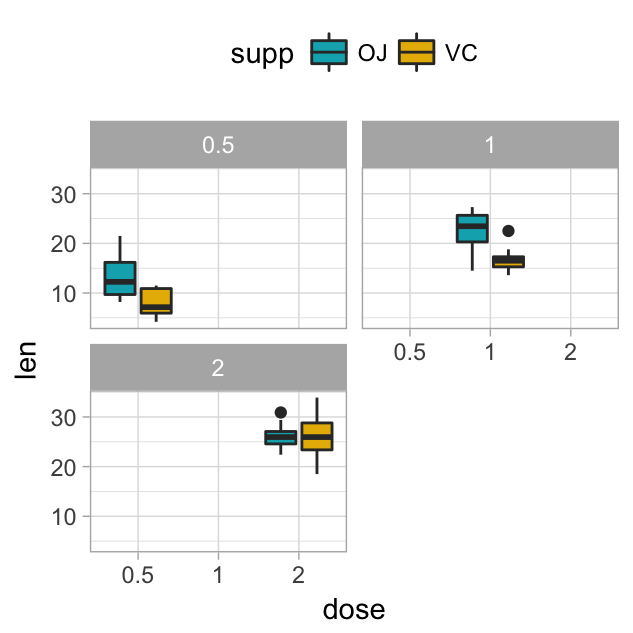
facet_wrap: Facets can be placed side by side using the function facet_wrap() as follow :
p + facet_wrap(~ dose)
p + facet_wrap(~ dose, ncol=2)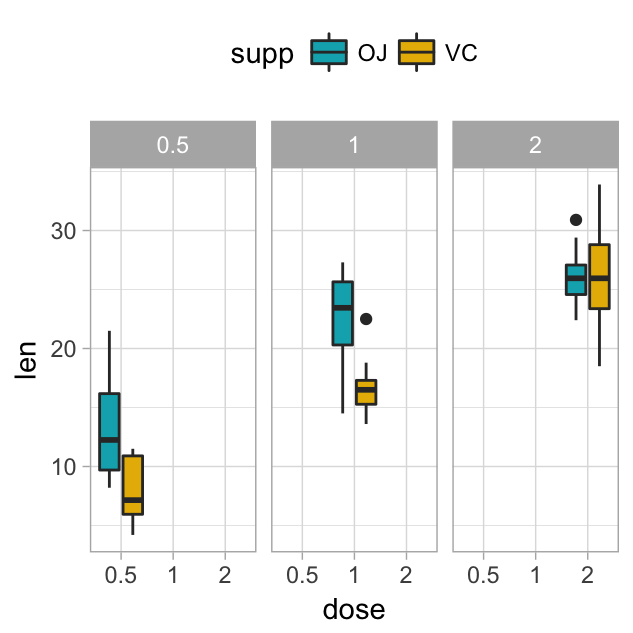
Facet scales
By default, all the panels have the same scales (scales="fixed"). They can be made independent, by setting scales to free, free_x, or free_y.
p + facet_grid(dose ~ supp, scales = 'free')Change facet labels
Change facet labels. The argument labeller can be used to change facet labels. Should be a function.
- In the following R code, facets are labelled by combining the name of the grouping variable with group levels. The labeller function
label_bothis used.
p + facet_grid(dose ~ supp, labeller = label_both)
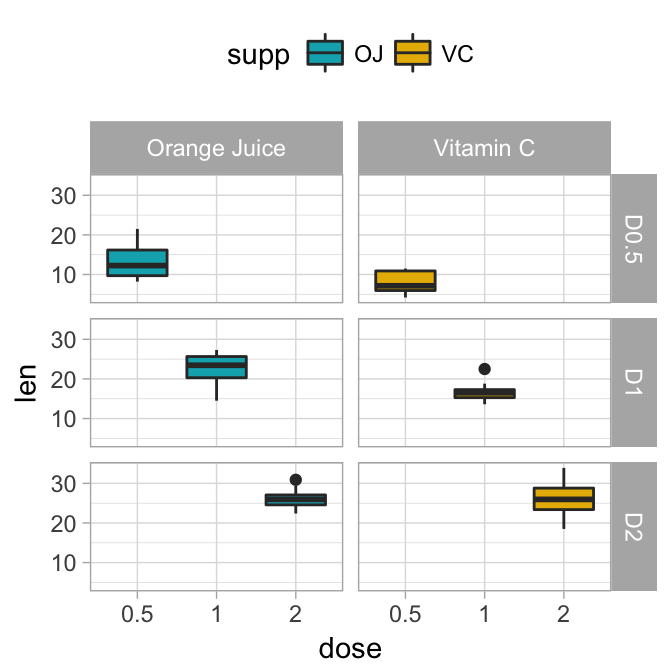
- A simple way to modify facet label text, is to provide new labels as a named character vector:
# New facet label names for dose variable
dose.labs <- c("D0.5", "D1", "D2")
names(dose.labs) <- c("0.5", "1", "2")
# New facet label names for supp variable
supp.labs <- c("Orange Juice", "Vitamin C")
names(supp.labs) <- c("OJ", "VC")
# Create the plot
p + facet_grid(
  dose ~ supp,
  labeller = labeller(dose = dose.labs, supp = supp.labs)
  )
- An alternative solution to change the facet labels, is to modify the data:
df <- ToothGrowth
# Modify the data
df$dose <- factor(df$dose, levels = c("0.5", "1", "2"),
                  labels = c("D0.5", "D1", "D2"))
df$supp <- factor(df$supp, levels = c("OJ", "VC"),
                  labels = c("Orange Juice", "Vitamin C")
                  )
# Create the plot
ggplot(df, aes(x = dose, y = len)) +
  geom_boxplot(aes(fill = supp)) +
  facet_grid(dose ~ supp)
Change facet labels appearance:
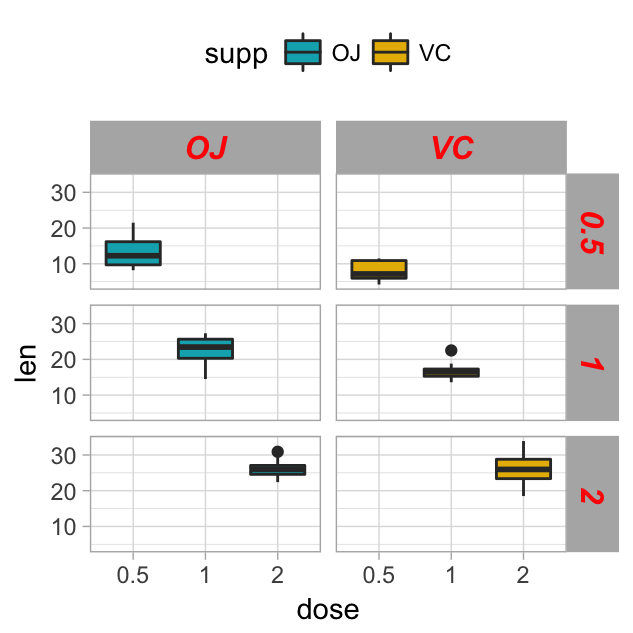
# Change facet text font. Possible values for the font style:
  #'plain', 'italic', 'bold', 'bold.italic'.
p + facet_grid(dose ~ supp)+
    theme(
      strip.text.x = element_text(
        size = 12, color = "red", face = "bold.italic"
        ),
      strip.text.y = element_text(
        size = 12, color = "red", face = "bold.italic"
        )
      )
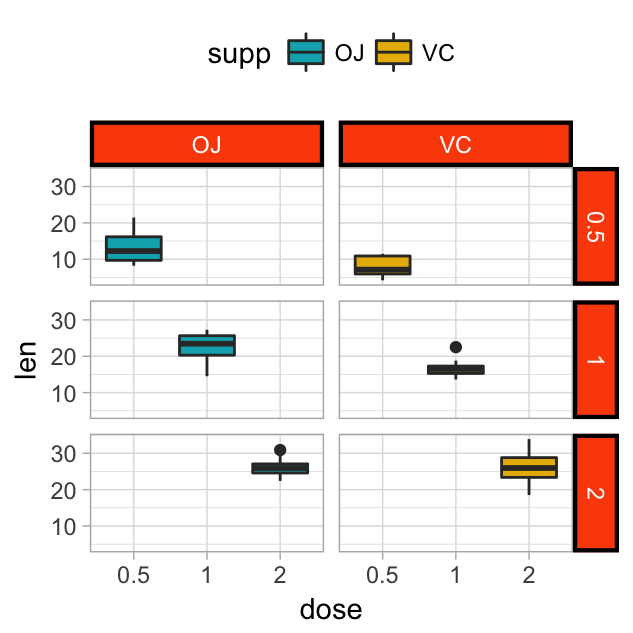
Change facet background color. The rectangle around facet labels can be modified using the function element_rect().
p + facet_grid(dose ~ supp)+
 theme(
   strip.background = element_rect(
     color="black", fill="#FC4E07", size=1.5, linetype="solid"
     )
   )
See also
- Create and Customize Multi-panel ggplots: Easy Guide to Facet. https://goo.gl/eRKHV7