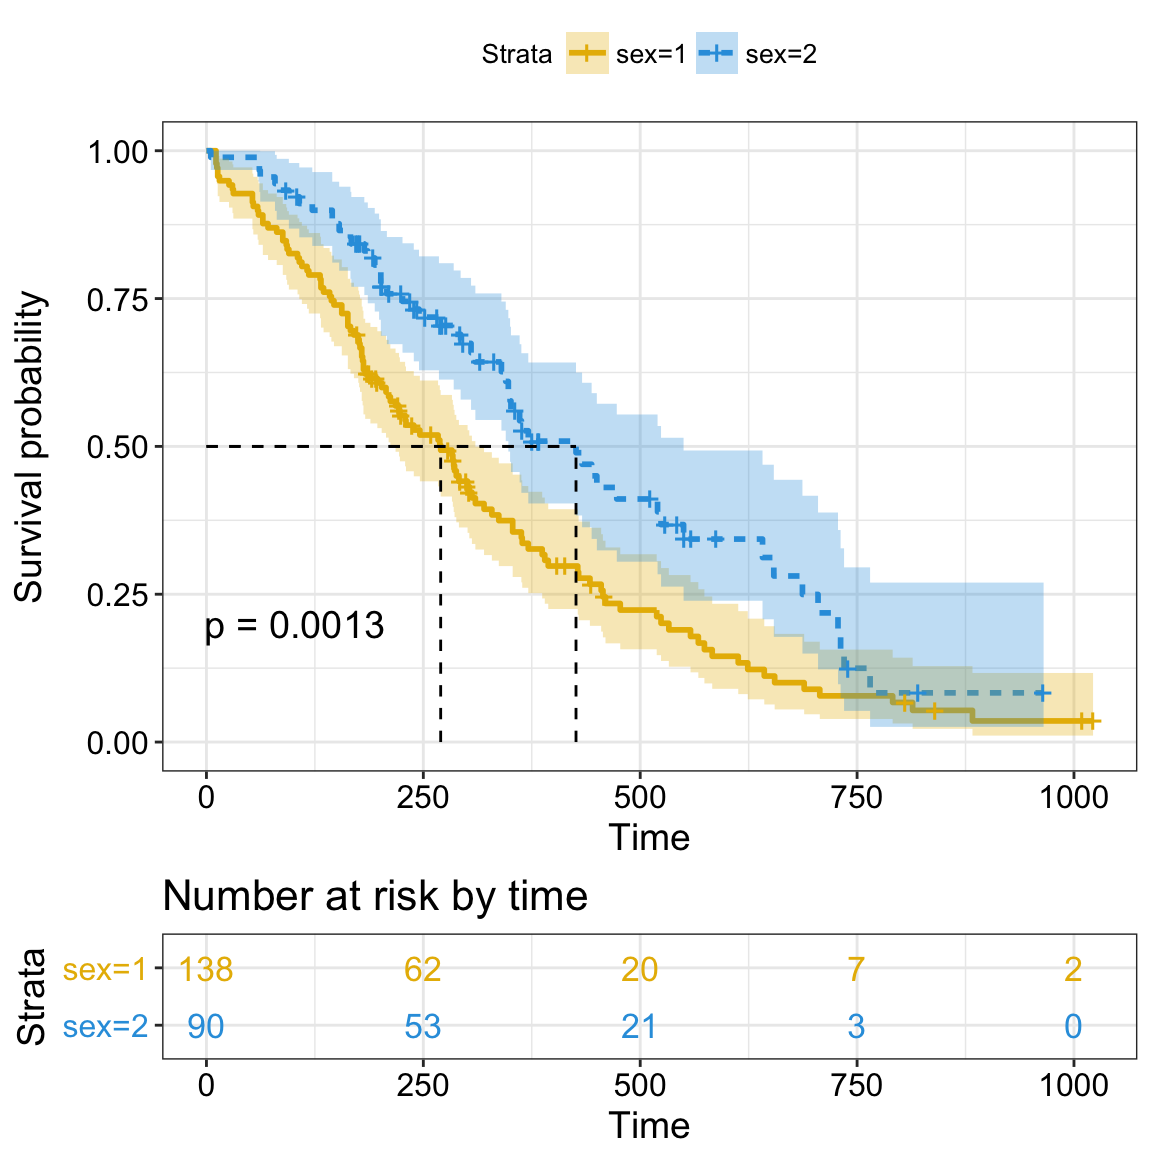
Survival Analysis
Survival analysis corresponds to a set of statistical methods for investigating the time it takes for an event of interest to occur.
In this chapter, we start by describing how to fit survival curves and how to perform logrank tests comparing the survival time of two or more groups of individuals. We continue by demonstrating how to assess simultaneously the impact of multiple risk factors on the survival time using the Cox regression model. Finally, we describe how to check the validy Cox model assumptions.
Survival analysis toolkits in R
We’ll use two R packages for survival data analysis and visualization :
- the survival package for survival analyses,
- and the survminer package for ggplot2-based elegant visualization of survival analysis results
For survival analyses, the following function [in survival package] will be used:
- Surv() to create a survival object
- survfit() to fit survival curves (Kaplan-Meier estimates)
- survdiff() to perform log-rank test comparing survival curves
- coxph() to compute the Cox proportional hazards model
For the visualization, we’ll use the following function available in the survminer package:
- ggsurvplot() for visualizing survival curves
- ggcoxzph(), ggcoxdiagnostics() and ggcoxfunctional() for checking the Cox model assumptions.
These two packages can be installed as follow:
install.packages("survival")
install.packages("survminer")
Contents
Survival analysis basics: curves and logrank tests

Survival analysis
- Objectives
- Basic concepts
- Survival time and type of events in cancer studies
- Censoring
- Survival and hazard functions
- Kaplan-Meier survival estimate
- Survival analysis in R
- Install and load required R package
- Example data sets
- Compute survival curves: survfit()
- Access to the value returned by survfit()
- Visualize survival curves
- Kaplan-Meier life table: summary of survival curves
- Log-Rank test comparing survival curves: survdiff()
- Fit complex survival curves
Read more –> Survival Analysis Basics: Curves and Logrank Tests
Cox proportional hazards model
- The need for multivariate statistical modeling
- Basics of the Cox proportional hazards model
- Compute the Cox model in R
- Install and load required R package
- R function to compute the Cox model: coxph()
- Example data sets
- Compute the Cox model
- Visualizing the estimated distribution of survival times
Read more –> Cox Proportional Hazards Model.
Cox model assumptions
- Diagnostics for the Cox model
- Assessing the validy of a Cox model in R
- Installing and loading required R packages
- Computing a Cox model
- Testing proportional Hazards assumption
- Testing influential observations
- Testing non linearity
Read more –> Cox Model Assumptions.
Infos
This analysis has been performed using R software (ver. 3.3.2).
Show me some love with the like buttons below... Thank you and please don't forget to share and comment below!!
Montrez-moi un peu d'amour avec les like ci-dessous ... Merci et n'oubliez pas, s'il vous plaît, de partager et de commenter ci-dessous!
Recommended for You!
Recommended for you
This section contains the best data science and self-development resources to help you on your path.
Books - Data Science
Our Books
- Practical Guide to Cluster Analysis in R by A. Kassambara (Datanovia)
- Practical Guide To Principal Component Methods in R by A. Kassambara (Datanovia)
- Machine Learning Essentials: Practical Guide in R by A. Kassambara (Datanovia)
- R Graphics Essentials for Great Data Visualization by A. Kassambara (Datanovia)
- GGPlot2 Essentials for Great Data Visualization in R by A. Kassambara (Datanovia)
- Network Analysis and Visualization in R by A. Kassambara (Datanovia)
- Practical Statistics in R for Comparing Groups: Numerical Variables by A. Kassambara (Datanovia)
- Inter-Rater Reliability Essentials: Practical Guide in R by A. Kassambara (Datanovia)
Others
- R for Data Science: Import, Tidy, Transform, Visualize, and Model Data by Hadley Wickham & Garrett Grolemund
- Hands-On Machine Learning with Scikit-Learn, Keras, and TensorFlow: Concepts, Tools, and Techniques to Build Intelligent Systems by Aurelien Géron
- Practical Statistics for Data Scientists: 50 Essential Concepts by Peter Bruce & Andrew Bruce
- Hands-On Programming with R: Write Your Own Functions And Simulations by Garrett Grolemund & Hadley Wickham
- An Introduction to Statistical Learning: with Applications in R by Gareth James et al.
- Deep Learning with R by François Chollet & J.J. Allaire
- Deep Learning with Python by François Chollet
Click to follow us on Facebook :
Comment this article by clicking on "Discussion" button (top-right position of this page)
Articles contained by this category :
Cox Model Assumptions
Cox Proportional-Hazards Model
Survival Analysis Basics


