


3D graphics
Previously, we described the essentials of R programming and provided quick start guides for importing data into R as well as visualizing data using R base graphs.
This chapter describes how to create static and interactive three-dimension (3D) graphs. We provide also an R package named graph3d to easily build and customize, step by step, 3D graphs in R software.
How this chapter is organized?
- Static 3D Scatter Plots
- Interactive 3D Graphs
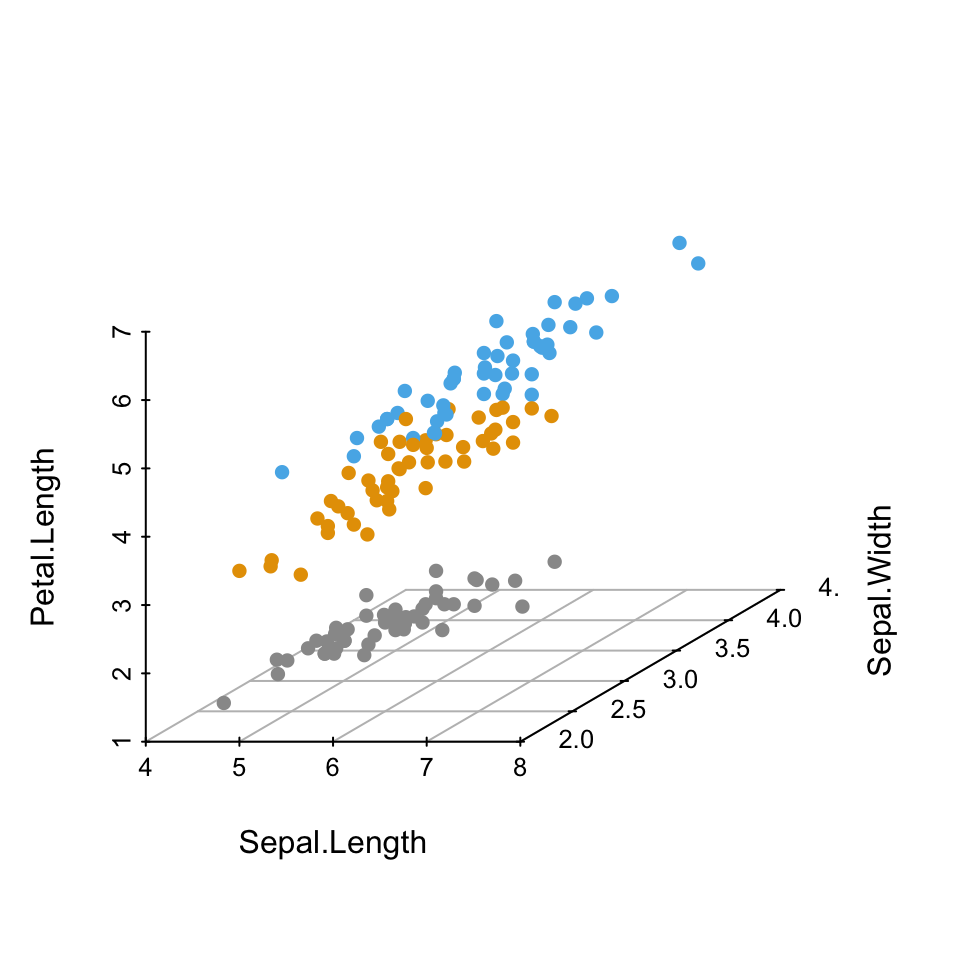
Simple 3D Scatter Plots: scatterplot3d Package
- Install and load scaterplot3d
- Prepare the data
- The function scatterplot3d()
- Basic 3D scatter plots
- Change the main title and axis labels
- Change the shape and the color of points
- Change point shapes by groups
- Change point colors by groups
- Change the global appearance of the graph
- Remove the box around the plot
- Add grids on scatterplot3d
- Add bars
- Modification of scatterplot3d output
- Add legends
- Add point labels
- Add regression plane and supplementary points
Read more: —> Simple 3D Scatter Plots: scatterplot3d Package.
Advanced 3D Graphs: plot3D Package
- Install and load plot3D package
- Prepare the data
- Scatter plots
- Basic scatter plot
- Change the type of the box around the plot
- Change the color by groups
- Change the position of the legend
- 3D viewing direction
- Titles and axis labels
- Tick marks and labels
- Add points and text to an existing plot
- Line plots
- Add confidence interval
- 3D fancy Scatter plot with small dots on basal plane
- Regression plane
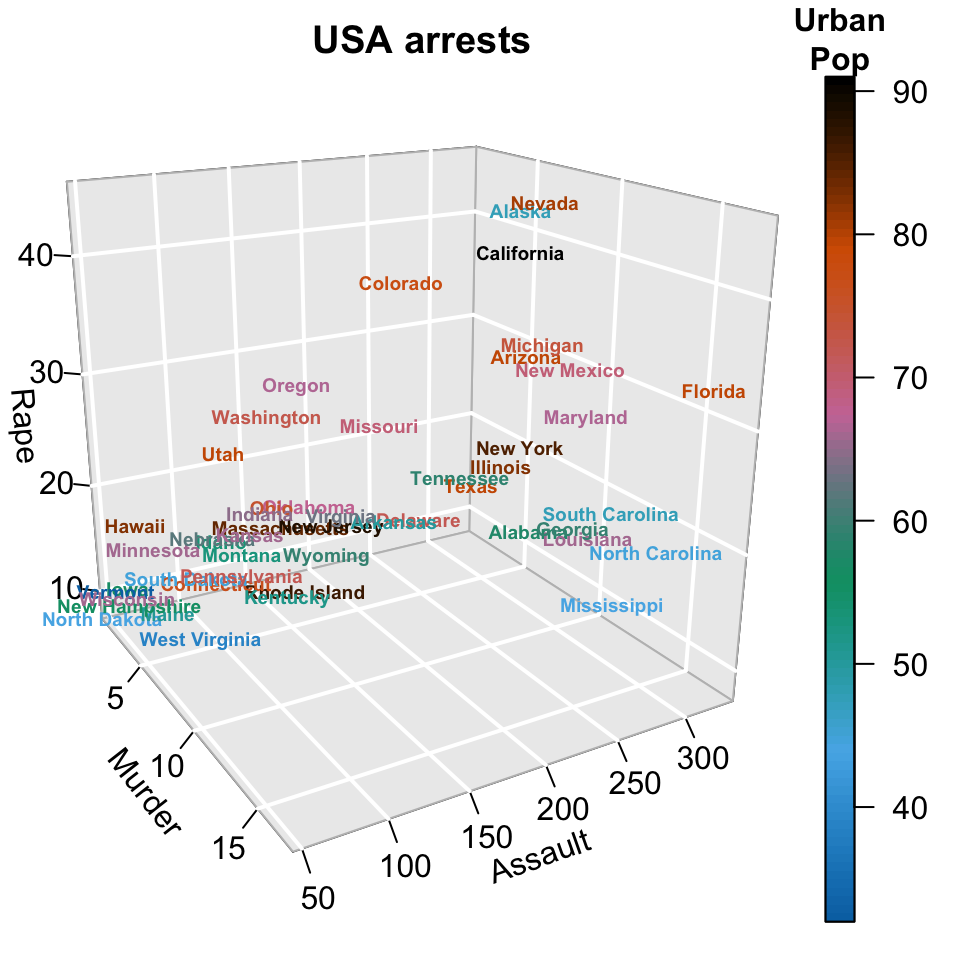
- text3D: plot 3-dimensionnal texts
- text3D and scatter3D
- 3D Histogram
- scatter2D: 2D scatter plot
- text2D
- Interactive plot
Read more: —> Advanced 3D Graphs: plot3D Package.
Interactive 3D Scatter Plots
- Install and load required packages
- Prepare the data
- The function scatter3d
- Basic 3D scatter plots
- Plot the points by groups
- Default plot
- Remove the surfaces
- Add concentration ellipsoids
- Change point colors by groups
- Axes
- Change axis labels
- Remove axis scales
- Change axis colors
- Add text labels for the points
- Export images
3d scatter plot rgl
Read more: —> Interactive 3D Scatter Plots.
Guide to RGL 3D Visualization System
- Install the RGL package
- Load the RGL package
- Prepare the data
- Start and close RGL device
- 3D scatter plot
- Basic graph
- Change the background and point colors
- Change the shape of points
- rgl_init(): A custom function to initialize RGL device
- Add a bounding box decoration
- Add axis lines and labels
- Set the aspect ratios of the x, y and z axes
- Change the color of points by groups
- Change the shape of points
- Add an ellipse of concentration
- Regression plane
- Create a movie of RGL scene
- Export images as png or pdf
- Export the plot into an interactive HTML file
- Select a rectangle in an RGL scene
- Identify points in a plot
- R3D Interface
- RGL functions
- Device management
- Shape functions
- Scene management
- Setup the environment
- Appearance setup
- Export screenshot
- Assign focus to an RGL window
RGL movie 3d
Read more —> Guide to RGL 3D Visualization System.
See also
Infos
This analysis has been performed using R statistical software (ver. 3.2.4).
Enjoyed this article? I’d be very grateful if you’d help it spread by emailing it to a friend, or sharing it on Twitter, Facebook or Linked In.
Show me some love with the like buttons below... Thank you and please don't forget to share and comment below!!
Show me some love with the like buttons below... Thank you and please don't forget to share and comment below!!
Avez vous aimé cet article? Je vous serais très reconnaissant si vous aidiez à sa diffusion en l'envoyant par courriel à un ami ou en le partageant sur Twitter, Facebook ou Linked In.
Montrez-moi un peu d'amour avec les like ci-dessous ... Merci et n'oubliez pas, s'il vous plaît, de partager et de commenter ci-dessous!
Montrez-moi un peu d'amour avec les like ci-dessous ... Merci et n'oubliez pas, s'il vous plaît, de partager et de commenter ci-dessous!
Recommended for You!


Recommended for you
This section contains best data science and self-development resources to help you on your path.
Coursera - Online Courses and Specialization
Data science
- Course: Machine Learning: Master the Fundamentals by Standford
- Specialization: Data Science by Johns Hopkins University
- Specialization: Python for Everybody by University of Michigan
- Courses: Build Skills for a Top Job in any Industry by Coursera
- Specialization: Master Machine Learning Fundamentals by University of Washington
- Specialization: Statistics with R by Duke University
- Specialization: Software Development in R by Johns Hopkins University
- Specialization: Genomic Data Science by Johns Hopkins University
Popular Courses Launched in 2020
- Google IT Automation with Python by Google
- AI for Medicine by deeplearning.ai
- Epidemiology in Public Health Practice by Johns Hopkins University
- AWS Fundamentals by Amazon Web Services
Trending Courses
- The Science of Well-Being by Yale University
- Google IT Support Professional by Google
- Python for Everybody by University of Michigan
- IBM Data Science Professional Certificate by IBM
- Business Foundations by University of Pennsylvania
- Introduction to Psychology by Yale University
- Excel Skills for Business by Macquarie University
- Psychological First Aid by Johns Hopkins University
- Graphic Design by Cal Arts
Books - Data Science
Our Books
- Practical Guide to Cluster Analysis in R by A. Kassambara (Datanovia)
- Practical Guide To Principal Component Methods in R by A. Kassambara (Datanovia)
- Machine Learning Essentials: Practical Guide in R by A. Kassambara (Datanovia)
- R Graphics Essentials for Great Data Visualization by A. Kassambara (Datanovia)
- GGPlot2 Essentials for Great Data Visualization in R by A. Kassambara (Datanovia)
- Network Analysis and Visualization in R by A. Kassambara (Datanovia)
- Practical Statistics in R for Comparing Groups: Numerical Variables by A. Kassambara (Datanovia)
- Inter-Rater Reliability Essentials: Practical Guide in R by A. Kassambara (Datanovia)
Others
- R for Data Science: Import, Tidy, Transform, Visualize, and Model Data by Hadley Wickham & Garrett Grolemund
- Hands-On Machine Learning with Scikit-Learn, Keras, and TensorFlow: Concepts, Tools, and Techniques to Build Intelligent Systems by Aurelien Géron
- Practical Statistics for Data Scientists: 50 Essential Concepts by Peter Bruce & Andrew Bruce
- Hands-On Programming with R: Write Your Own Functions And Simulations by Garrett Grolemund & Hadley Wickham
- An Introduction to Statistical Learning: with Applications in R by Gareth James et al.
- Deep Learning with R by François Chollet & J.J. Allaire
- Deep Learning with Python by François Chollet
Get involved :
Click to follow us on Facebook and Google+ :
Comment this article by clicking on "Discussion" button (top-right position of this page)
Click to follow us on Facebook and Google+ :
Comment this article by clicking on "Discussion" button (top-right position of this page)
Articles contained by this category :
A complete guide to 3D visualization device system in R - R software and data visualization
Amazing interactive 3D scatter plots - R software and data visualization
Impressive package for 3D and 4D graph - R software and data visualization
Scatterplot3d: 3D graphics - R software and data visualization