
Partitional clustering (or partitioning clustering) are clustering methods used to classify observations, within a data set, into multiple groups based on their similarity. The algorithms require the analyst to specify the number of clusters to be generated.
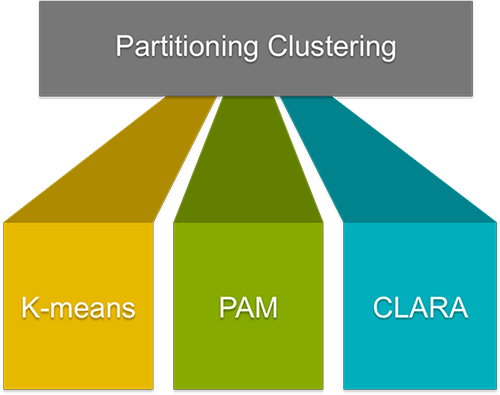
This course describes the commonly used partitional clustering, including:
- K-means clustering (MacQueen 1967), in which, each cluster is represented by the center or means of the data points belonging to the cluster. The K-means method is sensitive to anomalous data points and outliers.
- K-medoids clustering or PAM (Partitioning Around Medoids, Kaufman & Rousseeuw, 1990), in which, each cluster is represented by one of the objects in the cluster. PAM is less sensitive to outliers compared to k-means.
- CLARA algorithm (Clustering Large Applications), which is an extension to PAM adapted for large data sets.
For each of these methods, we provide:
- the basic idea and the key mathematical concepts
- the clustering algorithm and implementation in R software
- R lab sections with many examples for cluster analysis and visualization
The following R packages will be used to compute and visualize partitioning clustering:
statspackage for computing K-meansclusterpackage for computing PAM and CLARA algorithmsfactoextrafor beautiful visualization of clusters
Related Book
Practical Guide to Cluster Analysis in RQuick start
Data preparation:
# Load data
data("USArrests")
my_data <- USArrests
# Remove any missing value (i.e, NA values for not available)
my_data <- na.omit(my_data)
# Scale variables
my_data <- scale(my_data)
# View the firt 3 rows
head(my_data, n = 3)
## Murder Assault UrbanPop Rape
## Alabama 1.2426 0.783 -0.521 -0.00342
## Alaska 0.5079 1.107 -1.212 2.48420
## Arizona 0.0716 1.479 0.999 1.04288Determine the optimal number of clusters for k-means clustering:
library("factoextra")
fviz_nbclust(my_data, kmeans,
             method = "gap_stat")
## Clustering k = 1,2,..., K.max (= 10): .. done
## Bootstrapping, b = 1,2,..., B (= 100) [one "." per sample]:
## .................................................. 50
## .................................................. 100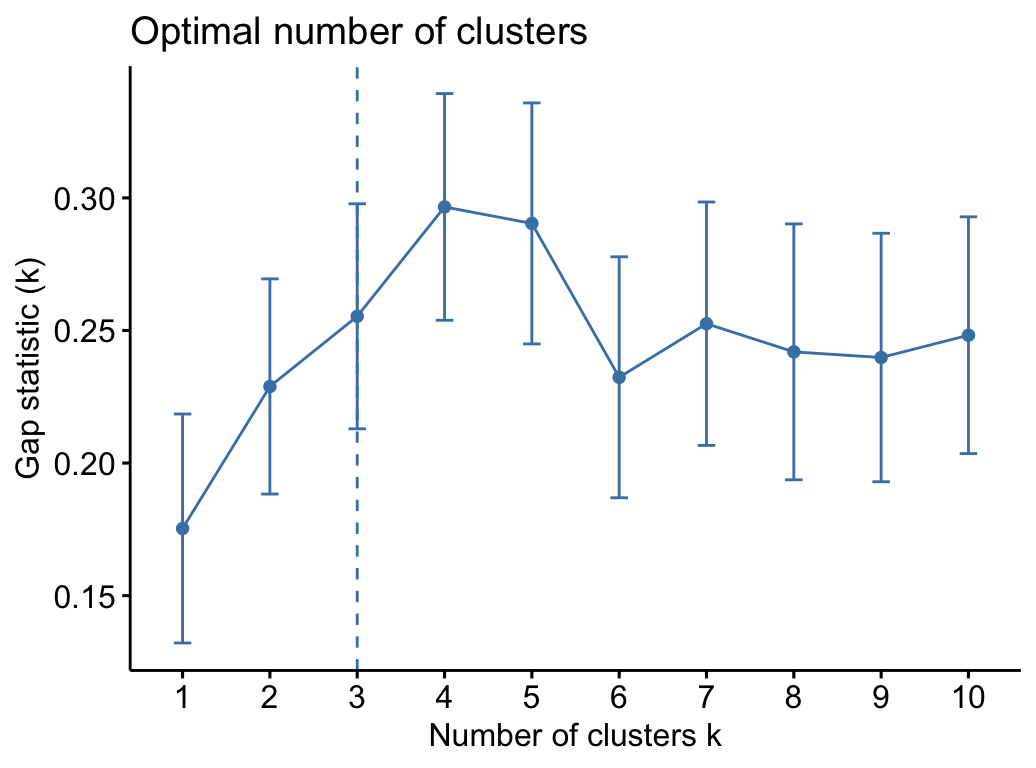
Compute and visualize k-means clustering:
set.seed(123)
km.res <- kmeans(my_data, 3, nstart = 25)

# Visualize
library("factoextra")
fviz_cluster(km.res, data = my_data,
             ellipse.type = "convex",
             palette = "jco",
             repel = TRUE,
             ggtheme = theme_minimal())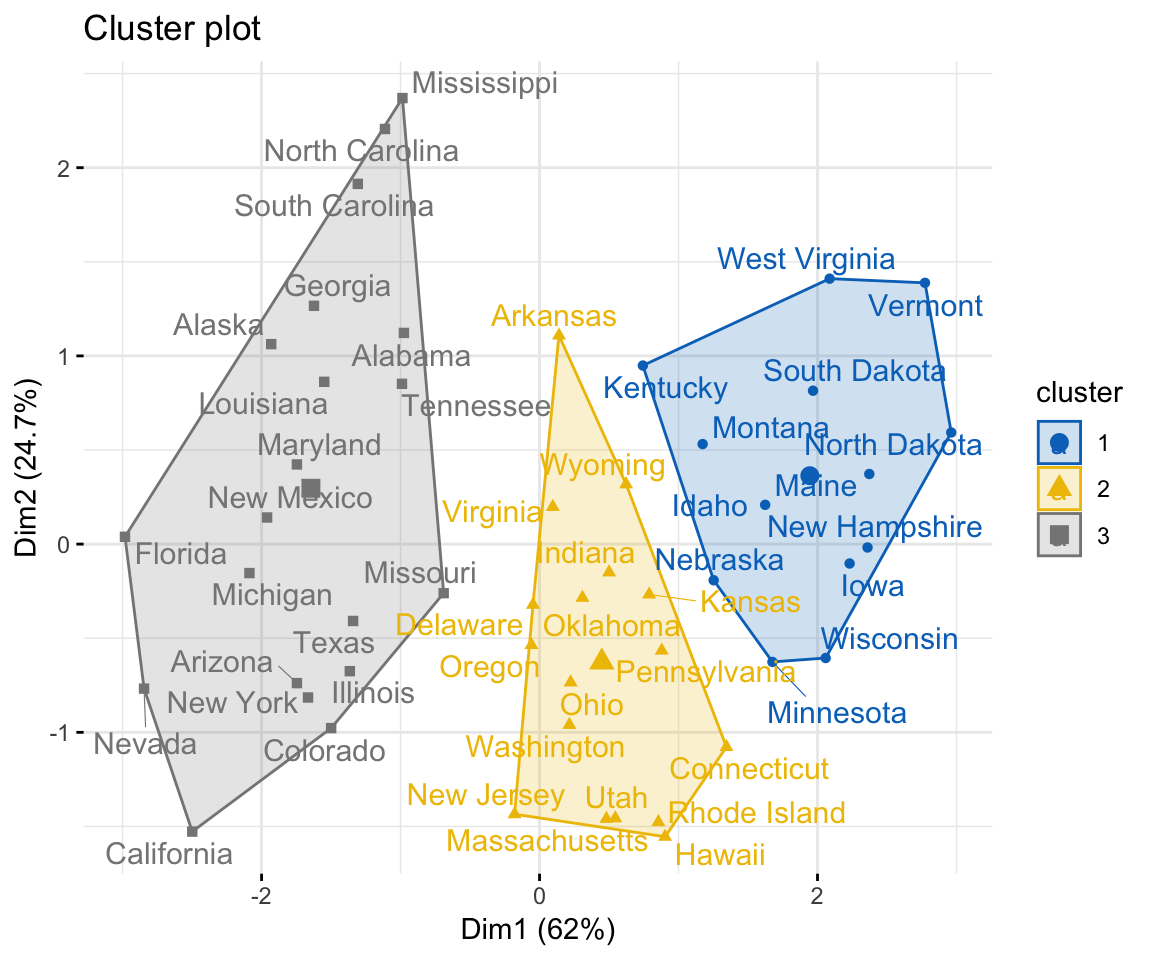
Similarly, you can compute and visualize PAM clustering as follow:
# Compute PAM
library("cluster")
pam.res <- pam(my_data, 4)
# Visualize
fviz_cluster(pam.res)
References
MacQueen, J. 1967. “Some Methods for Classification and Analysis of Multivariate Observations.” In Proceedings of the Fifth Berkeley Symposium on Mathematical Statistics and Probability, Volume 1: Statistics, 281–97. Berkeley, Calif.: University of California Press. http://projecteuclid.org:443/euclid.bsmsp/1200512992.


 (6 votes, average: 4.67 out of 5)


so why does the graph shows Dim1 vs Dim 2? Are they talking about the dimensions as such PC1 and PC2? If so, does kmeans function do PCA before clustering?
Dim1 and Dim2 corresponds to principal components 1 and 2, respectively.
No, k-means does not compute PCA. The K-means clustering identifies only the grouping of the samples.
Visualization is performed using the function fviz_cluster().
1/ If you have only two variables (x, y) in your dataset, then a standard scatter plot of x vs y is drawn by fviz_cluster() and points will be colored by groups.
2/ If you have more than two variables in the data set, then the function fviz_cluster() performs PCA to reduce the dimensionality of the data, and uses PC1 (Dim1) and PC2 (Dim2) to visualize the data.
The function fviz_cluster() [factoextra package] can be used to easily visualize k-means clusters. It takes k-means results and the original data as arguments. In the resulting plot, observations are represented by points, using principal components if the number of variables is greater than 2.
May I extract from the function fviz_cluster() the PCs composition?
Why gap_stat as the method and not wss as utilized in the next class