


R Built-in Data Sets
R comes with several built-in data sets, which are generally used as demo data for playing with R functions.
Preleminary tasks
Launch RStudio as described here: Running RStudio and setting up your working directory
List of pre-loaded data
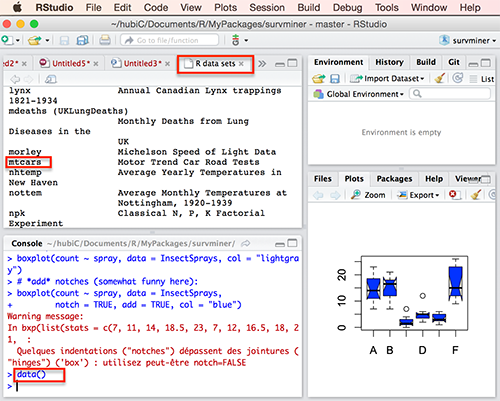
To see the list of pre-loaded data, type the function data():
data()The output is as follow:
Loading a built-in R data
Load and print mtcars data as follow:
# Loading
data(mtcars)
# Print the first 6 rows
head(mtcars, 6)
mpg cyl disp hp drat wt qsec vs am gear carb
Mazda RX4 21.0 6 160 110 3.90 2.620 16.46 0 1 4 4
Mazda RX4 Wag 21.0 6 160 110 3.90 2.875 17.02 0 1 4 4
Datsun 710 22.8 4 108 93 3.85 2.320 18.61 1 1 4 1
Hornet 4 Drive 21.4 6 258 110 3.08 3.215 19.44 1 0 3 1
Hornet Sportabout 18.7 8 360 175 3.15 3.440 17.02 0 0 3 2
Valiant 18.1 6 225 105 2.76 3.460 20.22 1 0 3 1If you want learn more about mtcars data sets, type this:
?mtcarsMost used R built-in data sets
mtcars: Motor Trend Car Road Tests
The data was extracted from the 1974 Motor Trend US magazine, and comprises fuel consumption and 10 aspects of automobile design and performance for 32 automobiles (1973–74 models)
- View the content of mtcars data set:
# 1. Loading
data("mtcars")
# 2. Print
head(mtcars)- It contains 32 observations and 11 variables:
# Number of rows (observations)
nrow(mtcars)
[1] 32# Number of columns (variables)
ncol(mtcars)[1] 11- Description of variables:
- mpg: Miles/(US) gallon
- cyl: Number of cylinders
- disp: Displacement (cu.in.)
- hp: Gross horsepower
- drat: Rear axle ratio
- wt: Weight (1000 lbs)
- qsec: 1/4 mile time
- vs: V/S
- am: Transmission (0 = automatic, 1 = manual)
- gear: Number of forward gears
- carb: Number of carburetors
If you want to learn more about mtcars, type this:
?mtcarsiris
iris data set gives the measurements in centimeters of the variables sepal length, sepal width, petal length and petal width, respectively, for 50 flowers from each of 3 species of iris. The species are Iris setosa, versicolor, and virginica.
data("iris")
head(iris)
Sepal.Length Sepal.Width Petal.Length Petal.Width Species
1 5.1 3.5 1.4 0.2 setosa
2 4.9 3.0 1.4 0.2 setosa
3 4.7 3.2 1.3 0.2 setosa
4 4.6 3.1 1.5 0.2 setosa
5 5.0 3.6 1.4 0.2 setosa
6 5.4 3.9 1.7 0.4 setosaToothGrowth
ToothGrowth data set contains the result from an experiment studying the effect of vitamin C on tooth growth in 60 Guinea pigs. Each animal received one of three dose levels of vitamin C (0.5, 1, and 2 mg/day) by one of two delivery methods, (orange juice or ascorbic acid (a form of vitamin C and coded as VC).
data("ToothGrowth")

head(ToothGrowth)
len supp dose
1 4.2 VC 0.5
2 11.5 VC 0.5
3 7.3 VC 0.5
4 5.8 VC 0.5
5 6.4 VC 0.5
6 10.0 VC 0.5- len: Tooth length
- supp: Supplement type (VC or OJ).
- dose: numeric Dose in milligrams/day
PlantGrowth
Results obtained from an experiment to compare yields (as measured by dried weight of plants) obtained under a control and two different treatment condition.
data("PlantGrowth")

head(PlantGrowth)
weight group
1 4.17 ctrl
2 5.58 ctrl
3 5.18 ctrl
4 6.11 ctrl
5 4.50 ctrl
6 4.61 ctrlUSArrests
This data set contains statistics about violent crime rates by us state.
data("USArrests")

head(USArrests)
Murder Assault UrbanPop Rape
Alabama 13.2 236 58 21.2
Alaska 10.0 263 48 44.5
Arizona 8.1 294 80 31.0
Arkansas 8.8 190 50 19.5
California 9.0 276 91 40.6
Colorado 7.9 204 78 38.7- Murder: Murder arrests (per 100,000)
- Assault: Assault arrests (per 100,000)
- UrbanPop: Percent urban population
- Rape: Rape arrests (per 100,000)
Summary
Load a built-in R data set: data(“dataset_name”)
- Inspect the data set: head(dataset_name)
Infos
This analysis has been performed using R (ver. 3.2.3).
Show me some love with the like buttons below... Thank you and please don't forget to share and comment below!!
Montrez-moi un peu d'amour avec les like ci-dessous ... Merci et n'oubliez pas, s'il vous plaît, de partager et de commenter ci-dessous!
Recommended for You!


Recommended for you
This section contains the best data science and self-development resources to help you on your path.
Books - Data Science
Our Books
- Practical Guide to Cluster Analysis in R by A. Kassambara (Datanovia)
- Practical Guide To Principal Component Methods in R by A. Kassambara (Datanovia)
- Machine Learning Essentials: Practical Guide in R by A. Kassambara (Datanovia)
- R Graphics Essentials for Great Data Visualization by A. Kassambara (Datanovia)
- GGPlot2 Essentials for Great Data Visualization in R by A. Kassambara (Datanovia)
- Network Analysis and Visualization in R by A. Kassambara (Datanovia)
- Practical Statistics in R for Comparing Groups: Numerical Variables by A. Kassambara (Datanovia)
- Inter-Rater Reliability Essentials: Practical Guide in R by A. Kassambara (Datanovia)
Others
- R for Data Science: Import, Tidy, Transform, Visualize, and Model Data by Hadley Wickham & Garrett Grolemund
- Hands-On Machine Learning with Scikit-Learn, Keras, and TensorFlow: Concepts, Tools, and Techniques to Build Intelligent Systems by Aurelien Géron
- Practical Statistics for Data Scientists: 50 Essential Concepts by Peter Bruce & Andrew Bruce
- Hands-On Programming with R: Write Your Own Functions And Simulations by Garrett Grolemund & Hadley Wickham
- An Introduction to Statistical Learning: with Applications in R by Gareth James et al.
- Deep Learning with R by François Chollet & J.J. Allaire
- Deep Learning with Python by François Chollet
Click to follow us on Facebook :
Comment this article by clicking on "Discussion" button (top-right position of this page)