


Kruskal-Wallis Test in R
What is Kruskal-Wallis test?
Visualize your data and compute Kruskal-Wallis test in R
Import your data into R
Prepare your data as specified here: Best practices for preparing your data set for R
Save your data in an external .txt tab or .csv files
Import your data into R as follow:
# If .txt tab file, use this
my_data <- read.delim(file.choose())
# Or, if .csv file, use this
my_data <- read.csv(file.choose())
Here, we’ll use the built-in R data set named PlantGrowth. It contains the weight of plants obtained under a control and two different treatment conditions.
my_data <- PlantGrowthCheck your data
# print the head of the file
head(my_data)
weight group
1 4.17 ctrl
2 5.58 ctrl
3 5.18 ctrl
4 6.11 ctrl
5 4.50 ctrl
6 4.61 ctrlIn R terminology, the column “group” is called factor and the different categories (“ctr”, “trt1”, “trt2”) are named factor levels. The levels are ordered alphabetically.
# Show the group levels
levels(my_data$group)
[1] "ctrl" "trt1" "trt2"If the levels are not automatically in the correct order, re-order them as follow:
my_data$group <- ordered(my_data$group,
                         levels = c("ctrl", "trt1", "trt2"))
It’s possible to compute summary statistics by groups. The dplyr package can be used.
- To install dplyr package, type this:
install.packages("dplyr")- Compute summary statistics by groups:
library(dplyr)
group_by(my_data, group) %>%
  summarise(
    count = n(),
    mean = mean(weight, na.rm = TRUE),
    sd = sd(weight, na.rm = TRUE),
    median = median(weight, na.rm = TRUE),
    IQR = IQR(weight, na.rm = TRUE)
  )
Source: local data frame [3 x 6]
group count mean sd median IQR
(fctr) (int) (dbl) (dbl) (dbl) (dbl)
1 ctrl 10 5.032 0.5830914 5.155 0.7425
2 trt1 10 4.661 0.7936757 4.550 0.6625
3 trt2 10 5.526 0.4425733 5.435 0.4675Visualize the data using box plots
To use R base graphs read this: R base graphs. Here, we’ll use the ggpubr R package for an easy ggplot2-based data visualization.
Install the latest version of ggpubr from GitHub as follow (recommended):
# Install
if(!require(devtools)) install.packages("devtools")
devtools::install_github("kassambara/ggpubr")- Or, install from CRAN as follow:
install.packages("ggpubr")- Visualize your data with ggpubr:
# Box plots
# ++++++++++++++++++++
# Plot weight by group and color by group
library("ggpubr")
ggboxplot(my_data, x = "group", y = "weight",
          color = "group", palette = c("#00AFBB", "#E7B800", "#FC4E07"),
          order = c("ctrl", "trt1", "trt2"),
          ylab = "Weight", xlab = "Treatment")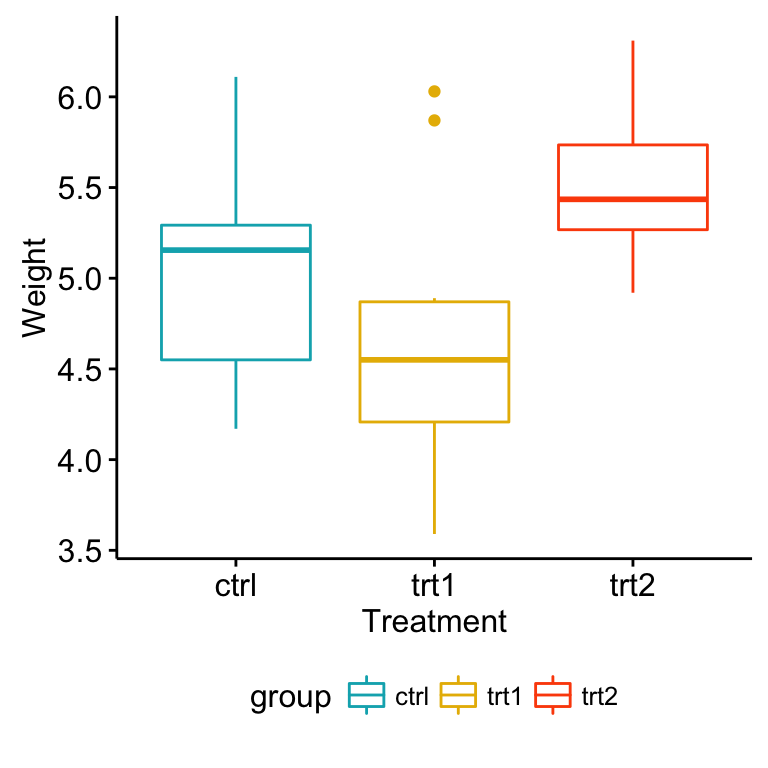
Kruskal-Wallis Test in R
# Mean plots
# ++++++++++++++++++++
# Plot weight by group
# Add error bars: mean_se
# (other values include: mean_sd, mean_ci, median_iqr, ....)
library("ggpubr")
ggline(my_data, x = "group", y = "weight",
       add = c("mean_se", "jitter"),
       order = c("ctrl", "trt1", "trt2"),
       ylab = "Weight", xlab = "Treatment")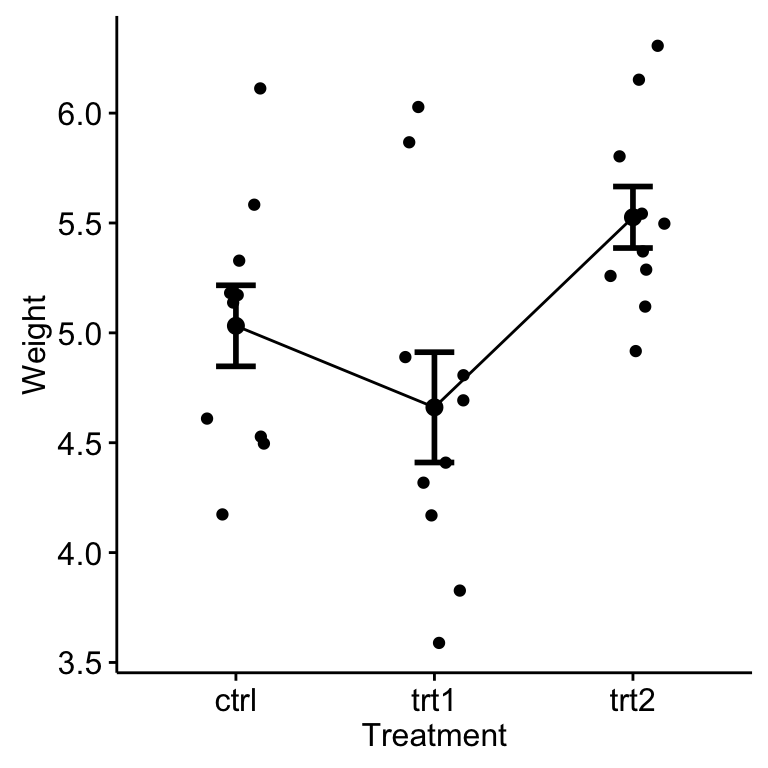
Kruskal-Wallis Test in R
Compute Kruskal-Wallis test
We want to know if there is any significant difference between the average weights of plants in the 3 experimental conditions.
The test can be performed using the function kruskal.test() as follow:
kruskal.test(weight ~ group, data = my_data)
    Kruskal-Wallis rank sum test
data:  weight by group
Kruskal-Wallis chi-squared = 7.9882, df = 2, p-value = 0.01842
Interpret
As the p-value is less than the significance level 0.05, we can conclude that there are significant differences between the treatment groups.
Multiple pairwise-comparison between groups
From the output of the Kruskal-Wallis test, we know that there is a significant difference between groups, but we don’t know which pairs of groups are different.
It’s possible to use the function pairwise.wilcox.test() to calculate pairwise comparisons between group levels with corrections for multiple testing.
pairwise.wilcox.test(PlantGrowth$weight, PlantGrowth$group,
                 p.adjust.method = "BH")
    Pairwise comparisons using Wilcoxon rank sum test
data:  PlantGrowth$weight and PlantGrowth$group
     ctrl  trt1
trt1 0.199 -
trt2 0.095 0.027
P value adjustment method: BH
The pairwise comparison shows that, only trt1 and trt2 are significantly different (p < 0.05).
See also
- Analysis of variance (ANOVA, parametric):
Infos
This analysis has been performed using R software (ver. 3.2.4).
Show me some love with the like buttons below... Thank you and please don't forget to share and comment below!!
Montrez-moi un peu d'amour avec les like ci-dessous ... Merci et n'oubliez pas, s'il vous plaît, de partager et de commenter ci-dessous!
Recommended for You!


Recommended for you
This section contains the best data science and self-development resources to help you on your path.
Books - Data Science
Our Books
- Practical Guide to Cluster Analysis in R by A. Kassambara (Datanovia)
- Practical Guide To Principal Component Methods in R by A. Kassambara (Datanovia)
- Machine Learning Essentials: Practical Guide in R by A. Kassambara (Datanovia)
- R Graphics Essentials for Great Data Visualization by A. Kassambara (Datanovia)
- GGPlot2 Essentials for Great Data Visualization in R by A. Kassambara (Datanovia)
- Network Analysis and Visualization in R by A. Kassambara (Datanovia)
- Practical Statistics in R for Comparing Groups: Numerical Variables by A. Kassambara (Datanovia)
- Inter-Rater Reliability Essentials: Practical Guide in R by A. Kassambara (Datanovia)
Others
- R for Data Science: Import, Tidy, Transform, Visualize, and Model Data by Hadley Wickham & Garrett Grolemund
- Hands-On Machine Learning with Scikit-Learn, Keras, and TensorFlow: Concepts, Tools, and Techniques to Build Intelligent Systems by Aurelien Géron
- Practical Statistics for Data Scientists: 50 Essential Concepts by Peter Bruce & Andrew Bruce
- Hands-On Programming with R: Write Your Own Functions And Simulations by Garrett Grolemund & Hadley Wickham
- An Introduction to Statistical Learning: with Applications in R by Gareth James et al.
- Deep Learning with R by François Chollet & J.J. Allaire
- Deep Learning with Python by François Chollet
Click to follow us on Facebook :
Comment this article by clicking on "Discussion" button (top-right position of this page)