


Practical Guide to Principal Component Methods in R
Introduction
Although there are several good books on principal component methods (PCMs) and related topics, we felt that many of them are either too theoretical or too advanced.
This book provides a solid practical guidance to summarize, visualize and interpret the most important information in a large multivariate data sets, using principal component methods in R.
Where to find the book:
- Download the PDF through payhip
- Read the ebook on google play
- Order a physical copy from amazon
- (Download the book preview)


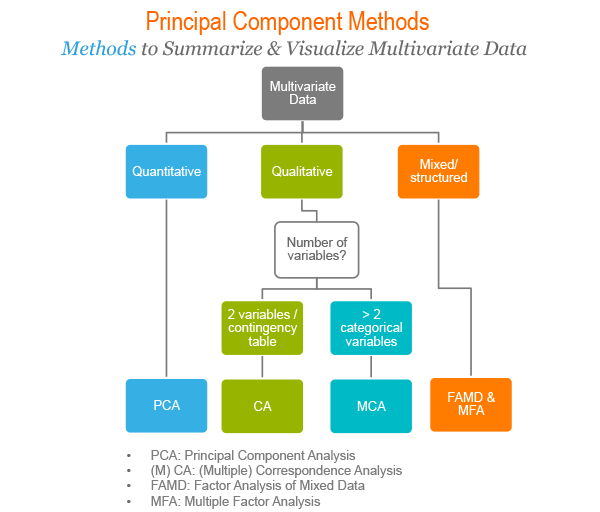
The following figure illustrates the type of analysis to be performed depending on the type of variables contained in the data set.
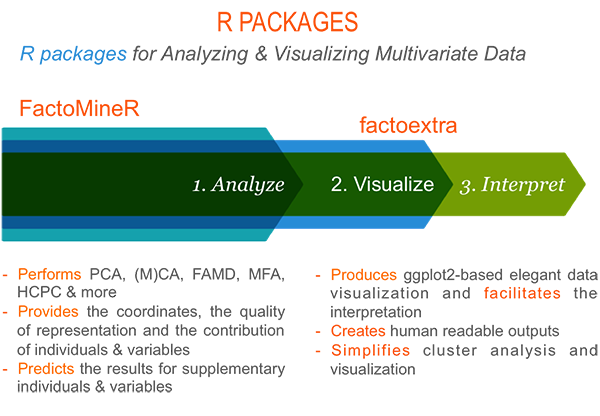
There are a number of R packages implementing principal component methods. These packages include: FactoMineR, ade4, stats, ca, MASS and ExPosition.
However, the result is presented differently depending on the used package.
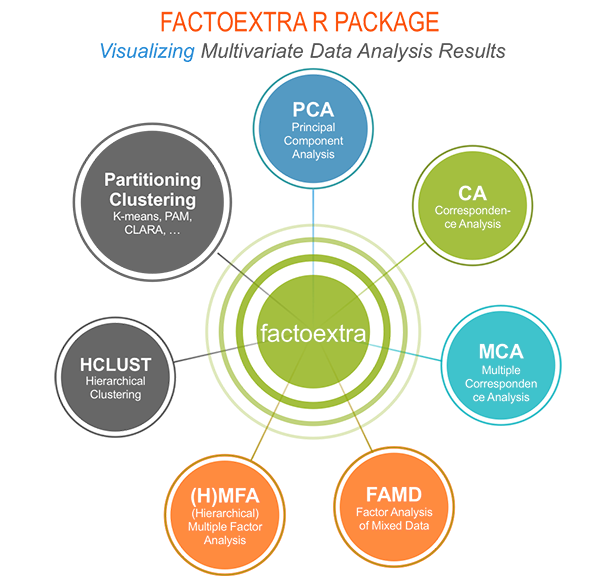
To help in the interpretation and in the visualization of multivariate analysis - such as cluster analysis and principal component methods - we developed an easy-to-use R package named factoextra (official online documentation: https://www.sthda.com/english/rpkgs/factoextra).
No matter which package you decide to use for computing principal component methods, the factoextra R package can help to extract easily, in a human readable data format, the analysis results from the different packages mentioned above. factoextra provides also convenient solutions to create ggplot2-based beautiful graphs.
Methods, which outputs can be visualized using the factoextra package are shown in the figure below:
In this book, we’ll use mainly:
- the FactoMineR package to compute principal component methods;
- and the factoextra package for extracting, visualizing and interpreting the results.
The other packages - ade4, ExPosition, etc - will be also presented briefly.
How this book is organized
This book contains 4 parts.
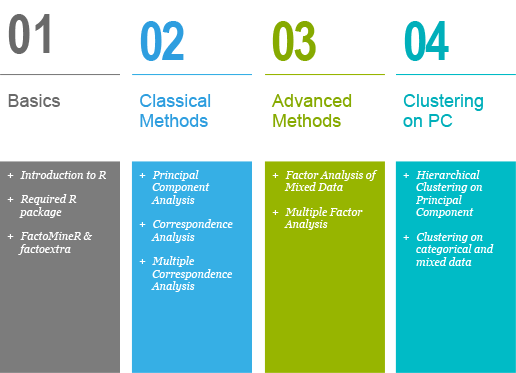
Part I provides a quick introduction to R and presents the key features of FactoMineR and factoextra.
Part II describes classical principal component methods to analyze data sets containing, predominantly, either continuous or categorical variables. These methods include:
- Principal Component Analysis (PCA, for continuous variables),
- Simple correspondence analysis (CA, for large contingency tables formed by two categorical variables)
- Multiple correspondence analysis (MCA, for a data set with more than 2 categorical variables).
In Part III, you’ll learn advanced methods for analyzing a data set containing a mix of variables (continuous and categorical) structured or not into groups:
- Factor Analysis of Mixed Data (FAMD) and,
- Multiple Factor Analysis (MFA).
Part IV covers hierarchical clustering on principal components (HCPC), which is useful for performing clustering with a data set containing only categorical variables or with a mixed data of categorical and continuous variables
Key features of this book
This book presents the basic principles of the different methods and provide many examples in R. This book offers solid guidance in data mining for students and researchers.
Key features:
- Covers principal component methods and implementation in R
- Highlights the most important information in your data set using ggplot2-based elegant visualization
- Short, self-contained chapters with tested examples that allow for flexibility in designing a course and for easy reference
At the end of each chapter, we present R lab sections in which we systematically work through applications of the various methods discussed in that chapter. Additionally, we provide links to other resources and to our hand-curated list of videos on principal component methods for further learning.
Examples of plots
Some examples of plots generated in this book are shown hereafter. You’ll learn how to create, customize and interpret these plots.
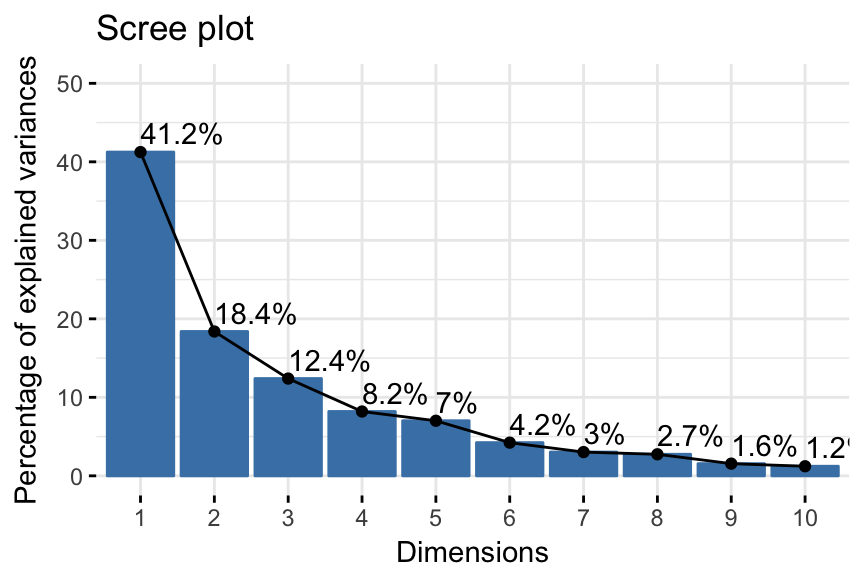
- Eigenvalues/variances of principal components. Proportion of information retained by each principal component.
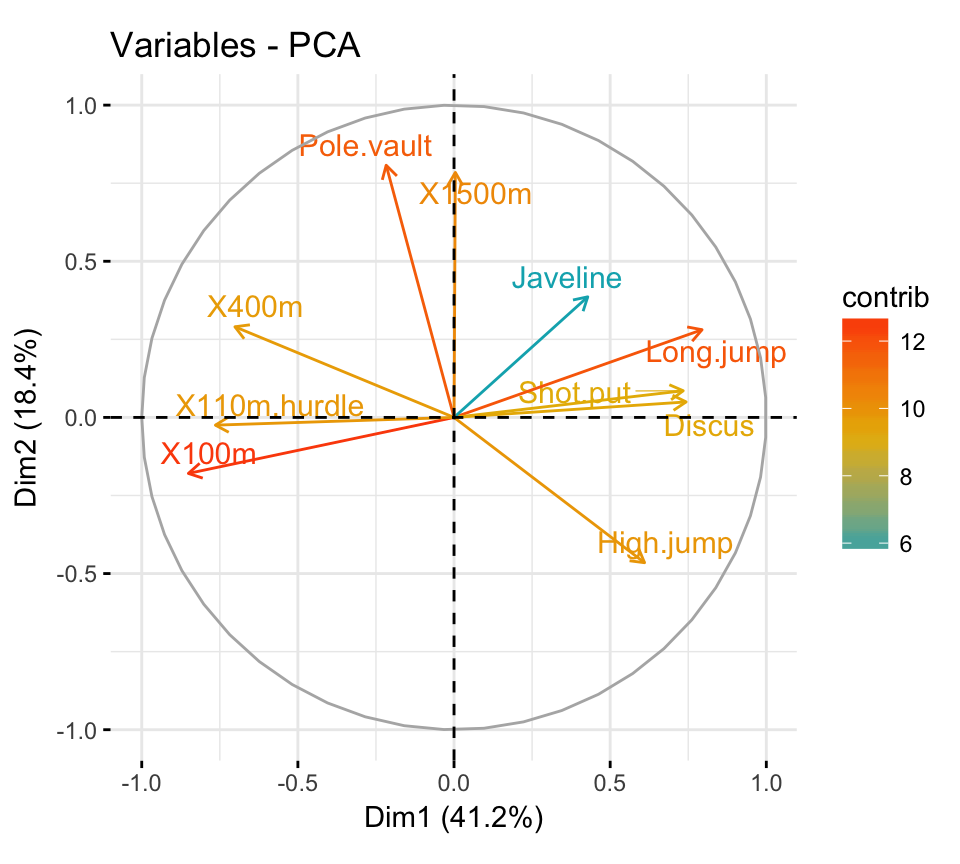
- PCA - Graph of variables:
- Control variable colors using their contributions to the principal components.
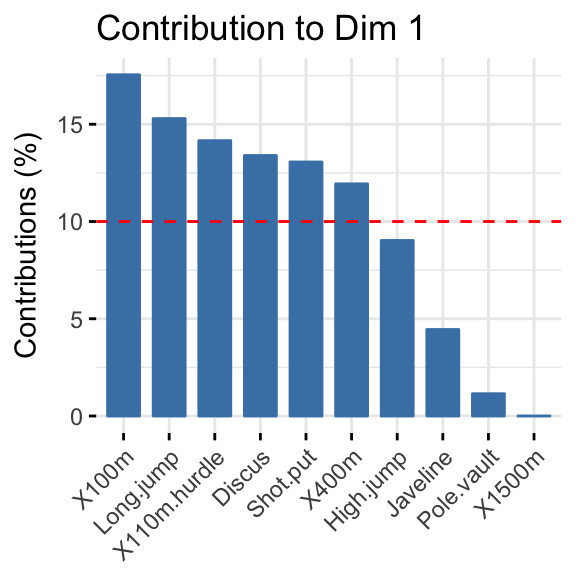
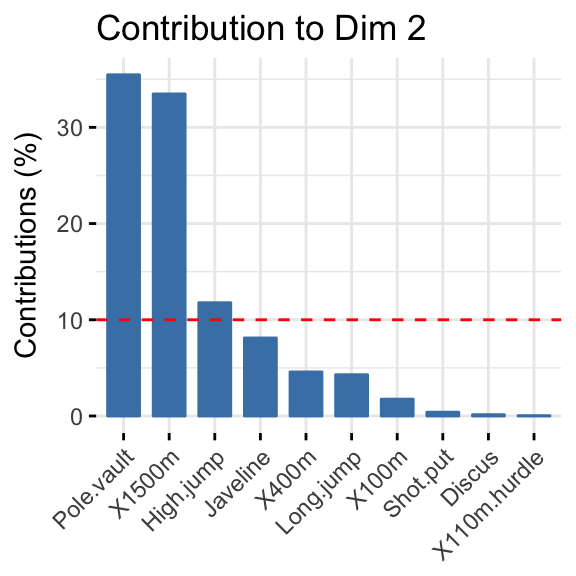
- Highlight the most contributing variables to each principal dimension:
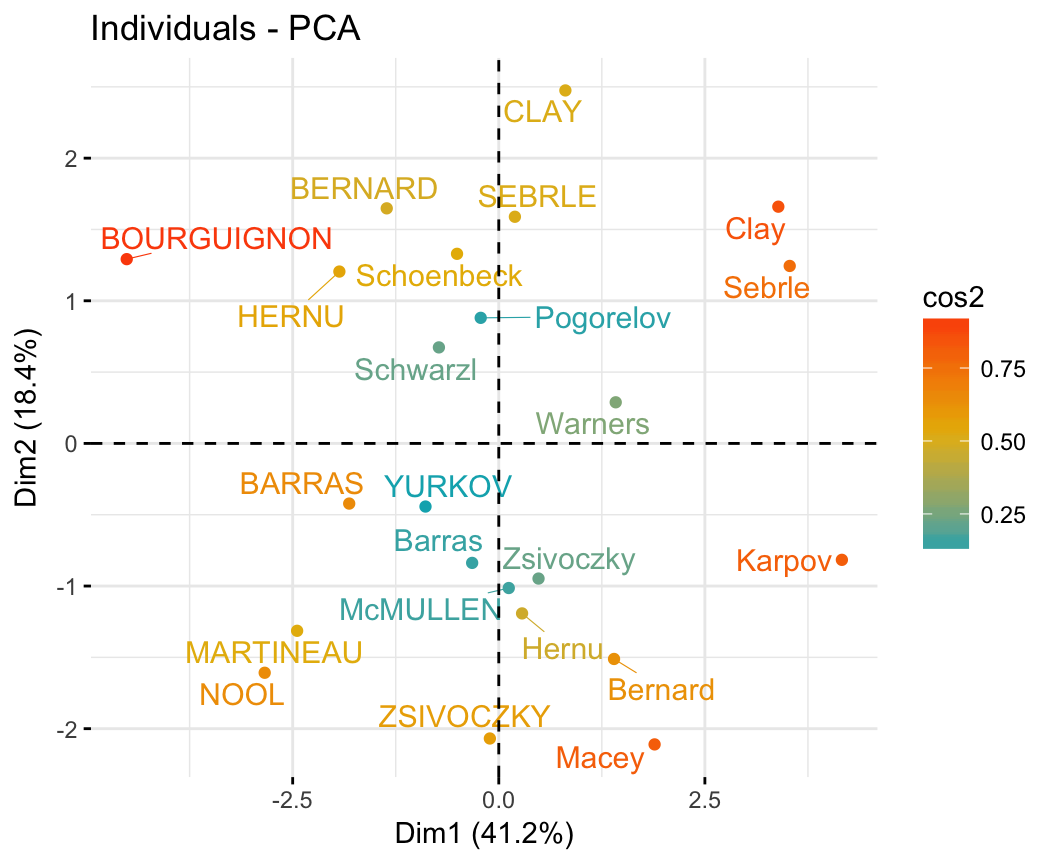
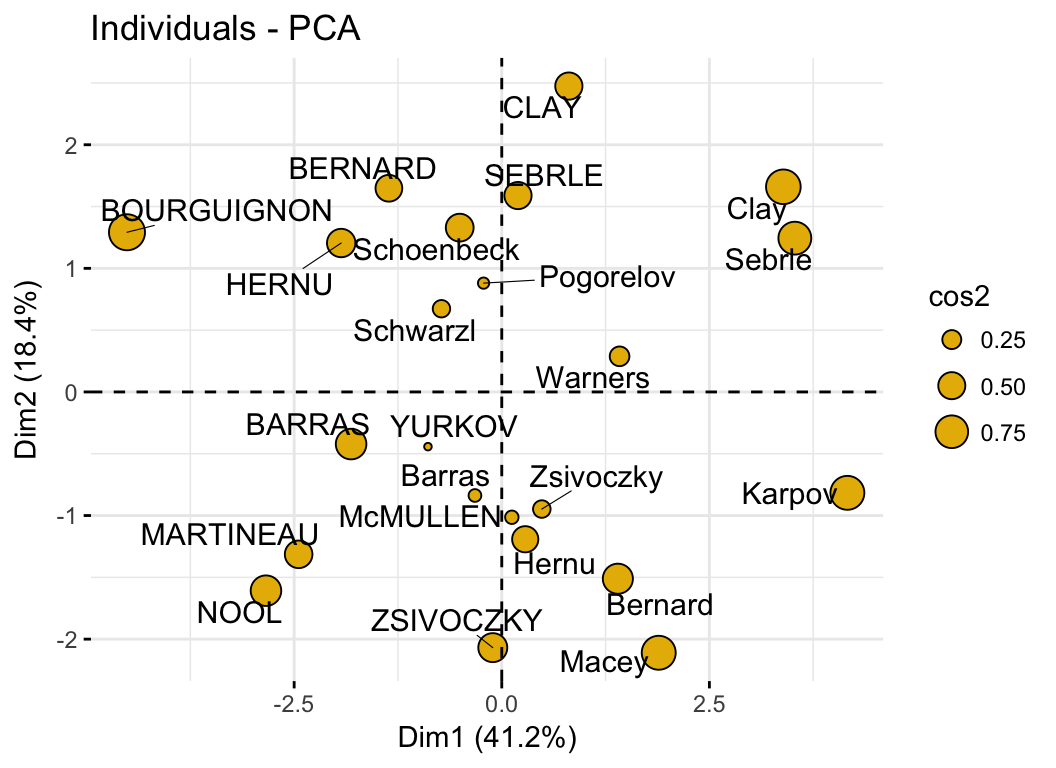
- PCA - Graph of individuals:
- Control automatically the color of individuals using the cos2 (the quality of the individuals on the factor map)
- Change the point size according to the cos2 of the corresponding individuals:
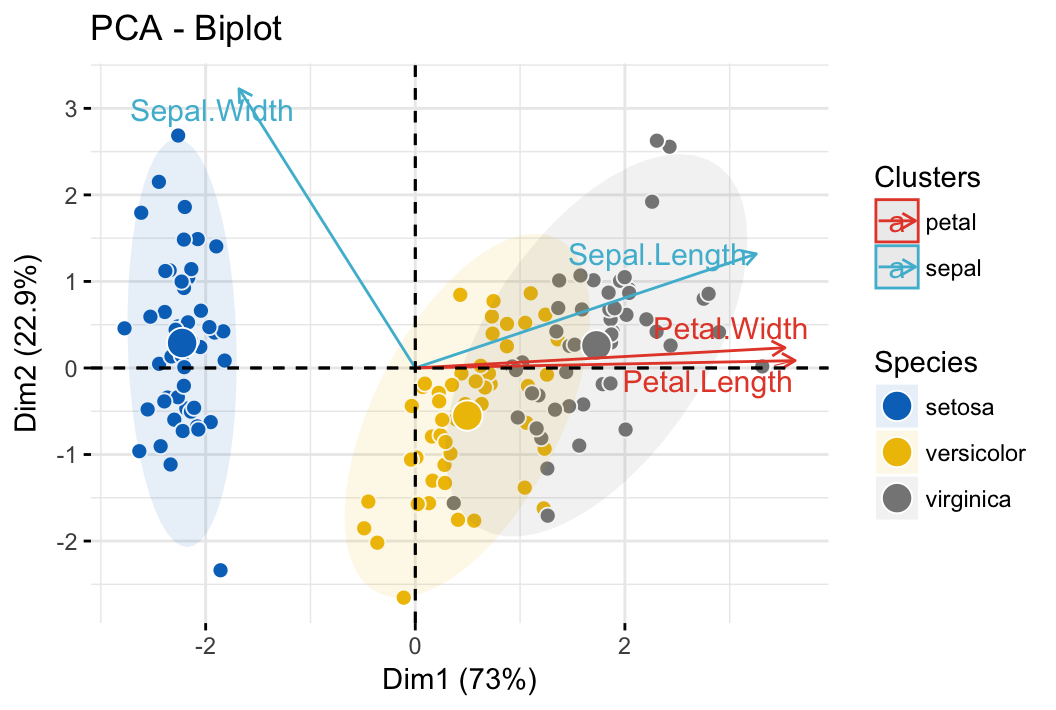
- PCA - Biplot of individuals and variables
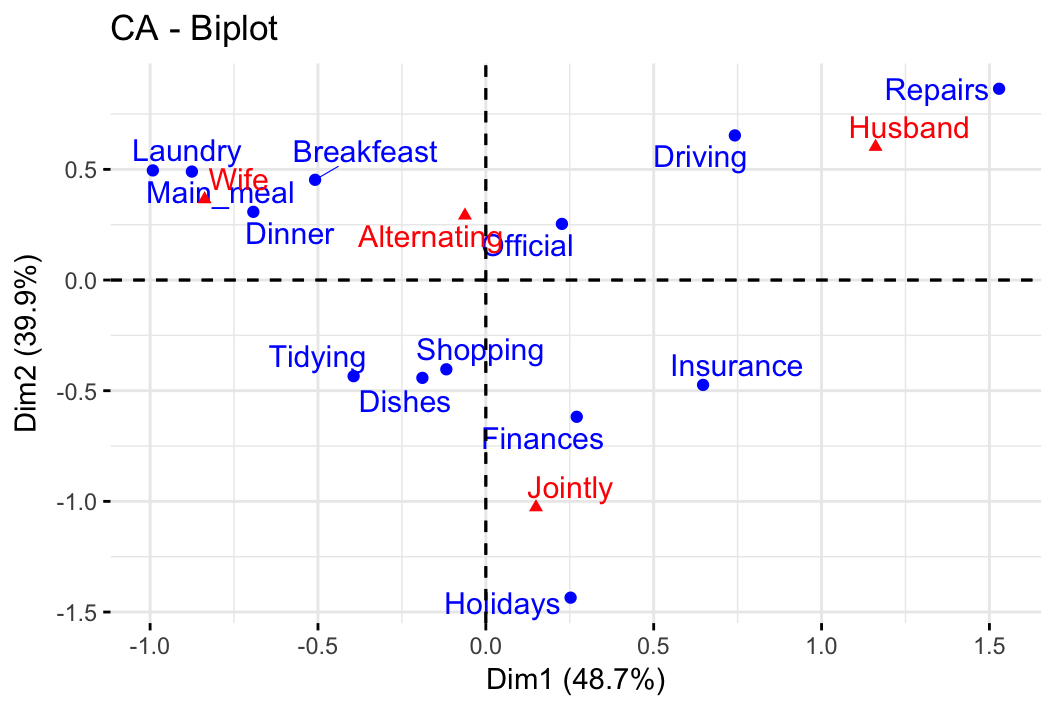
- Correspondence analysis. Association between categorical variables.
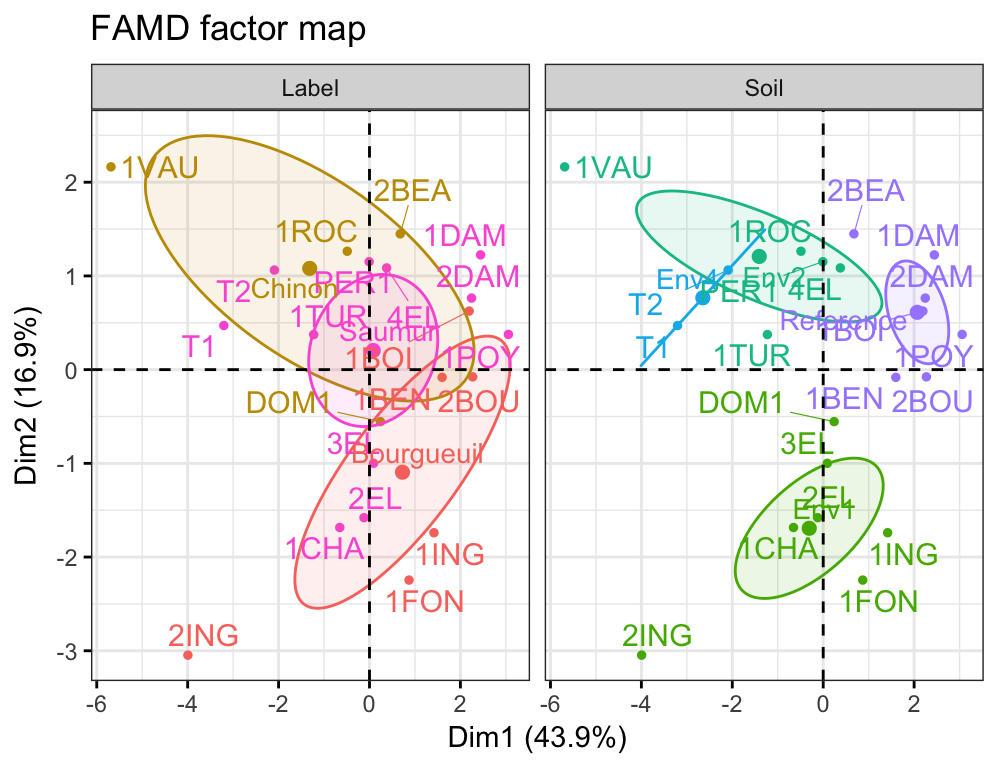
- FAMD/MFA - Analyzing mixed and structured data
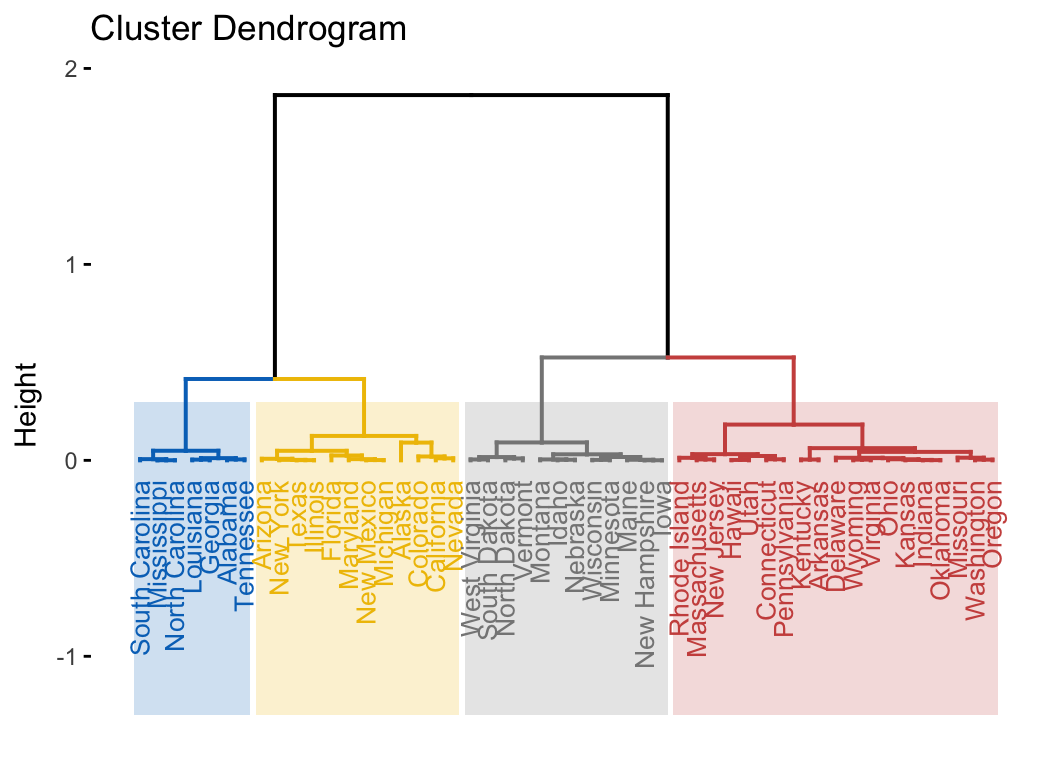
- Clustering on principal components
Book preview
Download the preview of the book at: Principal Component Methods in R (Book preview)
Order now
Show me some love with the like buttons below... Thank you and please don't forget to share and comment below!!
Montrez-moi un peu d'amour avec les like ci-dessous ... Merci et n'oubliez pas, s'il vous plaît, de partager et de commenter ci-dessous!
Recommended for You!


Recommended for you
This section contains the best data science and self-development resources to help you on your path.
Books - Data Science
Our Books
- Practical Guide to Cluster Analysis in R by A. Kassambara (Datanovia)
- Practical Guide To Principal Component Methods in R by A. Kassambara (Datanovia)
- Machine Learning Essentials: Practical Guide in R by A. Kassambara (Datanovia)
- R Graphics Essentials for Great Data Visualization by A. Kassambara (Datanovia)
- GGPlot2 Essentials for Great Data Visualization in R by A. Kassambara (Datanovia)
- Network Analysis and Visualization in R by A. Kassambara (Datanovia)
- Practical Statistics in R for Comparing Groups: Numerical Variables by A. Kassambara (Datanovia)
- Inter-Rater Reliability Essentials: Practical Guide in R by A. Kassambara (Datanovia)
Others
- R for Data Science: Import, Tidy, Transform, Visualize, and Model Data by Hadley Wickham & Garrett Grolemund
- Hands-On Machine Learning with Scikit-Learn, Keras, and TensorFlow: Concepts, Tools, and Techniques to Build Intelligent Systems by Aurelien Géron
- Practical Statistics for Data Scientists: 50 Essential Concepts by Peter Bruce & Andrew Bruce
- Hands-On Programming with R: Write Your Own Functions And Simulations by Garrett Grolemund & Hadley Wickham
- An Introduction to Statistical Learning: with Applications in R by Gareth James et al.
- Deep Learning with R by François Chollet & J.J. Allaire
- Deep Learning with Python by François Chollet
Click to follow us on Facebook :
Comment this article by clicking on "Discussion" button (top-right position of this page)