


Create and format PowerPoint documents from R software
Why is it important to be able to generate a PowerPoint report from R ?
There are at least, two reasons for this, as described in the next sections.
Reason I : Many collaborators works with Microsoft office tools
About 1 billion people worldwide use Microsoft Office (1 in 7 people on the planet; source: Microsoft).
Furthermore, many collaborators still working with MS Office software (Word, PowerPoint, Excel) for :
- editing their text and tracking changes
- copy-pasting texts, images and tables from multiple sources
- saving and analyzing their data
In this context, a report generated as a PDF or HTMl files is less useful with some collaborators.
Reason II : keeping beautiful R graphs beautifull for publications
R plots can be customized to be as beautiful as your imagination can make them. Unfortunately, preserving this beauty is not always an easy task when you want to publish these graphs or show them in a professional presentations.
Yes, this problem can be solved using knitr/rmarkdown/Latex/Beamer/Slidify. However, it would be very difficult to remake the whole presentation in a different format. Furthermore, many journals don’t accept Latex documents.
But wasn’t this problem solved already?
The answer of this question is yes and no. There have been several attempts to solve this problem, but many of them are not easy to use.
One of the previous solutions is R2PPT package. Unfortunately R2PPT is available for Windows OS only and it depends on rcom or RDCOMClient for generating Microsoft PowerPoint presentations.
Objective
The goal of this R tutorial is to show you how to easily and quickly, format and export R outputs (including data tables, plots, paragraphs of text and R scripts) from R statistical software to a Microsoft PowerPoint document (.pptx file format) using ReporteRs package.
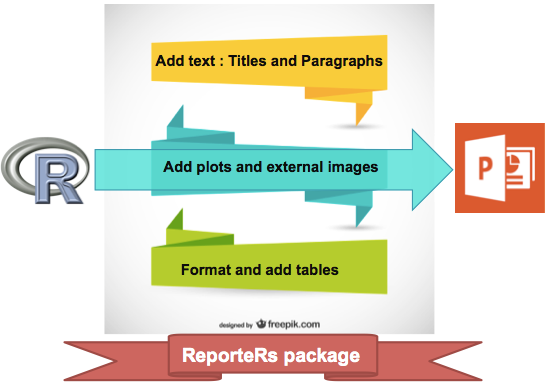
ReporteRs is a Java-based solution, so it works on Windows, Mac and Linux.
Install and load the ReporteRs package
Use the R code below :
install.packages('ReporteRs') # Install
library('ReporteRs') # Load
Note that ReporteRs relies on Java (>= 1.6) ; make sure you have an installed JRE
The version of Java installed on your computer, can be checked as follow :
system("java -version")Create a simple PowerPoint document
Four simple steps are required :
- Use the pptx() function to create a PowerPoint object.
- Use the addSlide() function to add a slide into the PowerPoint document.
- Add contents into the created slide using the functions below :
- addTitle: Add a title
- addParagraph: Add paragraphs of text
- addFlexTable: Add a table
- addPlot: Add a plot generated in R
- addImage: Add external images
- addRScript: Highlight and add R code
- addDate : Add a date
- addPageNumber : Add a page number
- AddFooter : Add a footer
- Write the document into a .pptx file using writeDoc() function
Slide layout
Before showing you an example of how to create and format PowerPoint from R Software, let’s first discuss about slide layout. This is very important to understand the examples provided in this tutorial.
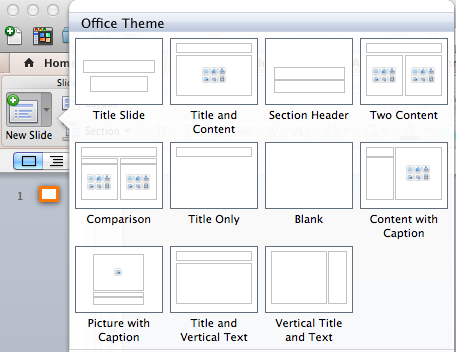
When creating a new slide, you should specify the layout of the slide. The available layouts in the “MS Office PowerPoint” (default template, on my computer) are illustrated in the figure below :
addSlide() function can be used to add a new slide into a PowerPoint document from R software. A simplified format of the function is :
doc <- addSlide(doc, slide.layout)- doc : a pptx object where slide has to be added
- slide.layout : the layout to use for the slide.
Among the possible values for the argument slide.layout, there are : “Title Slide”, “Title and Content”, “Two Content”, “Section Header”, “Content with Caption”, “Title Only”, “Comparison”.
However, you should use only the available slide layouts in your computer.
To view the slide layouts available in your computer, use the R code below :
library(ReporteRs)
doc = pptx()
slide.layouts(doc)
[1] "Title Slide" "Title and Vertical Text" "Title and Content" "Two Content"
[5] "Section Header" "Vertical Title and Text" "Content with Caption" "Title Only"
[9] "Comparison" "Blank" These layouts are illustrated below :
doc <- pptx()
layouts <-slide.layouts(doc) # All available layout
#  plot each slide style
for(i in layouts ){
  par(mar=c(0.5,0.5,2,0.5), cex=0.7)
  slide.layouts(doc, i )
    title(main = paste0("'", i, "'" ))
  if(interactive()) readline(prompt = "Show next slide layout")
}


Note that, the selected layout determines the contents you can add into the slide (See the figure above).
- Example 1 - If you choose ‘Title and Content’ as a slide layout, you can add only :
- a title
- and one content which can be texts, plots, images, tables or R code
- Example 2 - If you choose ‘Two Content’ as a slide layout, you can add :
- a title
- and two contents : For example, you can add a table in the left panel and a paragraph of texts in the right panel.
- Example 3 - If you choose ‘Comparison’, you can add a title and four contents (plots, tables, paragraphs, images)
Whatever the slide layout chosen, you can use the functions addDate(), addFooter() and addPageNumber() to add date, footer and slide number, respectively.
Generate a simple PowerPoint document from R software
The R code below creates a PowerPoint document with a title slide, plots, tables, and an R script :
library( ReporteRs )
# Create a PowerPoint document
doc = pptx( )
# Slide 1 : Title slide
#+++++++++++++++++++++++
doc <- addSlide(doc, "Title Slide")
doc <- addTitle(doc,"Create a PowerPoint document from R software")
doc <- addSubtitle(doc, "R and ReporteRs package")
doc <- addDate(doc)
doc <- addFooter(doc, "Isaac Newton")
doc <- addPageNumber(doc, "1/4")
# Slide 2 : Add plot
#+++++++++++++++++++++++
doc <- addSlide(doc, "Title and Content")
doc <- addTitle(doc, "Bar plot")
plotFunc<- function(){
  barplot(VADeaths, beside = TRUE,
          col = c("lightblue", "mistyrose", "lightcyan",
                  "lavender", "cornsilk"),
  legend = rownames(VADeaths), ylim = c(0, 100))
  title(main = "Death Rates in Virginia", font.main = 4)
}
doc <- addPlot(doc, plotFunc )
doc <- addPageNumber(doc, "2/4")
# Slide 3 : Add table
#+++++++++++++++++++++++
doc <- addSlide(doc, "Two Content")
doc <- addTitle(doc,"iris data sets")
doc <- addFlexTable(doc, FlexTable(iris[1:10,] ))
doc <- addParagraph(doc, "iris data set gives the measurements in centimeters of the variables sepal length and width and petal length and width, respectively, for 50 flowers from each of 3 species of iris. The species are Iris setosa, versicolor, and virginica.")
doc <- addPageNumber(doc, "3/4")
# Silde 4 : Add R script
#+++++++++++++++++++++
doc <- addSlide(doc, "Content with Caption")
doc <- addTitle(doc, "R Script for histogram plot")
doc <- addPlot(doc, function() hist(iris$Sepal.Width, col=4))
r_code ="data(iris)
hist(iris$Sepal.Width, col = 4)"
doc <- addRScript(doc, text=r_code)
# write the document
writeDoc(doc, "r-reporters-powerpoint.pptx" )
The PowerPoint document created by the R code above is available here : R software and ReporteRs package - Example of creating a PowerPoint document
Note that, you can use addPageNumber() function without specifying the value of the slide number, as follow :
doc <- addPageNumber(doc)In this case slide number is added using the default setting (e.g : 1 for slide1, 2 for slide 2).
If you want to customize the numbering, use the function as follow :
doc <- addPageNumber(doc, "1/2") # Example 1
doc <- addPageNumber(doc, "I") # Example 2
Format the text of a PowerPoint document
Text properties : font, color and size
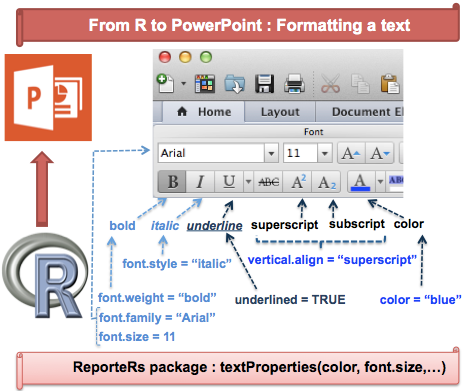
As illustrated in the figure below, text properties include :
- Font : family (e.g : “Arial”), size (e.g : 11), style (e.g : “italic”)
- Underlined text
- Color (e.g : “blue”)
- Vertical align (superscript, subscript)
The default font size and font family of the PowerPoint can be modified as follow :
options( "ReporteRs-fontsize" = 18,
         "ReporteRs-default-font" = "Arial")
Change the appearance of a “Piece Of Text” (pot)

The function pot() [Pieces Of Text] is used to modify the appearance of a text. It can be used also to create a hyperlink. The format is :
pot(value="", format = textProperties())- value : the text to be formatted
- format : the properties to use for formatting the text
The allowed values for the argument format are the following functions :
- textProperties() : the text formatting properties
- textBold(), textItalic(), textBoldItalic() and textNormal() which are shortcuts for bold, italic, bold-italic and normal text, respectively.
These functions can take the arguments below :
- color : font color; e.g : color=“#000000” or color = “black”.
- font.size : a integer indicating the font size.
- font.weight : the font weight. Possible values are “normal” or “bold”.
- font.style : the font style. Possible values are “normal” or “italic”.
- underlined : a logical value specifying if the text should be underlined.
- font.family : the font family; e.g : “Arial”.
- vertical.align : a character indicating font vertical alignments. Expected values are “baseline”" or “subscript” or “superscript”. Default value is baseline.
- shading.color : background color of the text (e.g “#000000” or “black”)
The R code below creates a PowerPoint document containing a formatted text and a hyperlink :
library( ReporteRs )
# Change the default font size and font family
options('ReporteRs-fontsize'= 18, 'ReporteRs-default-font'='Arial')
doc = pptx( )
doc <- addSlide(doc, "Two Content")
doc <- addTitle(doc,"Document with formatted texts")
doc <- addFlexTable(doc, FlexTable(iris[1:10,] ))
my_text <- pot("iris data set", textBold(color = "blue"))+
          " contains the measurements of " +
          pot("sepal length", textBold(color="red"))+
        " and width and petal length and width"

my_link <- pot('Click here to visit STHDA web site!',
    hyperlink = 'https://www.sthda.com/english',
    format=textBoldItalic(color = 'blue', underline = TRUE ))
doc <- addParagraph(doc,
      value = set_of_paragraphs(my_text, " ",  my_link),
     par.properties=parProperties(text.align="justify")
    )
writeDoc(doc, "r-reporters-powerpoint-formatted.pptx" )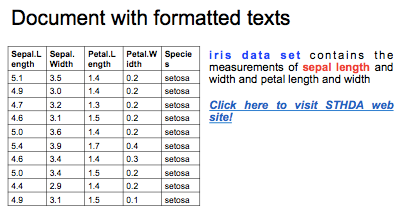
Add plots and images
The functions addPlot() and addImage() can be used for adding a plot or an external image to the document. addPlot() works with all R plots (base graphics, lattice, ggplot2 and grid).
These two functions can be used as follow :
# Add plots
# fun : R plotting function
# ... : other arguments to pass to the plotting function
addPlot(doc, fun, ...)
# Add images
# filename : path to the external image
addImage(doc, filename)
The R code below creates a PowerPoint document containing a histogram and an image (downloaded from R website) :
library( ReporteRs )
doc = pptx()
# Slide 1 : Title slide
doc <- addSlide(doc, "Title Slide")
doc <- addTitle(doc,"Document containing plots and images")
doc <- addSubtitle(doc, "R and ReporteRs package")
# Slide 2 : Add plot
doc <- addSlide(doc, "Two Content")
doc <- addTitle(doc,"Histogram plot")
doc <- addPlot(doc, function() hist(iris$Sepal.Width, col="lightblue"))
doc <- addParagraph(doc, "This histogram is generated using iris data sets")
# Slide 3 : Add  an image
# download an image from R website
download.file(url="http://www.r-project.org/hpgraphic.png",
              destfile="r-home-image.png", quiet=TRUE)
doc <- addSlide(doc, "Two Content")
doc <- addTitle(doc,"Image from R website")
doc <- addImage(doc, "r-home-image.png")
doc <- addParagraph(doc, "This image has been downloaded from R website")

writeDoc(doc, "r-reporters-powerpoint-plot-image.pptx")
The PowerPoint document created by the R code above is available here : R software and ReporteRs package - PowerPoint document containing plots and images
Note that, addPlot() function can take other arguments such as pointsize to change the size of plotted texts (default value is 12; in pixels)
- For addImage() function, the allowed file formats are PNG, WMF, JPEG and GIF images..
Add a table
addFlexTable() function is used to format and add a table into the PowerPoint.
It can be used as follow :
- STEP 1 : Create a table using FlexTable() or vanilla.table() function. These two functions generate a ‘flexible’ table which can be easily formatted before adding into the slide.
- STEP 2 : Add the create table into the document using addFlexTable() function as follow :
# doc : pptx object
# flextable : FlexTable object
# Example 1
doc <- addFlexTable(doc, flextable = FlexTable(data))
# Example 2
doc <- addFlexTable(doc, flextable = vanilla.table(data))
setZebraStyle() function can be used to color odd and even rows differently; for example, odd rows in gray color and even rows in white color.
The example below creates a PowerPoint document with 3 slides containing a simple table (slide 1), vanilla table (slide 2) and a zebra striped table (slide 3) :
doc = pptx()
data<-iris[1:5, ]
# Slide 1 : Simple table
doc <- addSlide(doc, "Title and Content")
doc <- addTitle(doc,"Simple table")
doc <- addFlexTable(doc, FlexTable(data))
# Slide 2 : vanilla table
doc <- addSlide(doc, "Title and Content")
doc <- addTitle(doc,"Vanilla table")
doc <- addFlexTable(doc, vanilla.table(data))
# Slide 3 : Zebra striped table
doc <- addSlide(doc, "Title and Content")
doc <- addTitle(doc,"Zebra striped table")
MyFTable <- vanilla.table(data)
MyFTable <- setZebraStyle(MyFTable, odd = '#eeeeee', even = 'white')
doc <- addFlexTable( doc, MyFTable)
writeDoc(doc, "r-reporters-powerpoint-add-table.pptx")
The PowerPoint document created by the R code above is available here : R software and ReporteRs package - PowerPoint document containing tables
Add ordered and unordered lists
Lists can be added using addParagraph() function as follow :
doc  <- addParagraph(doc,
  value = c('Item 1', "Item 2", "Item 3")
par.properties = parProperties(list.style = 'ordered', level = 1 )- value : a set of items to be added as a list
- par.properties : the paragraph formatting properties. It takes list.style and level as arguments :
- list.style : possible values are ‘unordered’ and ‘ordered’
- level : a numeric value indicating the level of the item to be added in the list
The example below generates a one-slide PowerPoint document containing an ordered and unordered lists :
doc <- pptx()
doc <- addSlide(doc, "Two Content")
doc <- addTitle(doc, "Ordered and unordored lists")
# 1. Ordered list
doc <- addParagraph(doc, value= c("Item 1", "Item 2", "Item 3"),
          par.properties =  parProperties(list.style = 'ordered'))
# 2. Unordered list
doc <- addParagraph(doc, value= c("Item 1", "Item 2", "Item 3"),
          par.properties =  parProperties(list.style = 'unordered'))
writeDoc(doc, file = "r-reporters-powerpoint-lists.pptx")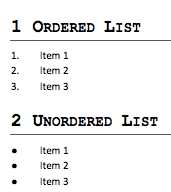
Create a PowerPoint document from a template file
This approach is useful in many situations :
- If you work in a corporate environment and you want to generate a PowerPoint document based on a template with specific fonts, color, logos, etc.
- If you want to modify and insert new contents into an existing PowerPoint document.
- If you want to use text formatting styles and slide layouts from a given template file.
Note that, if you use a template file to create a PowerPoint document, slide layouts are those available in the template.
A template file can be specified to the pptx() function as follow :
# Create a PowerPoint document
doc <- pptx(template="path/to/your/powerpoint/template/file.pptx")
# ...............
# Add contents
# ...............
# Write the PowerPoint document to a file
writeDoc(doc, file = "output-file.pptx")
In the next section We’ll :
- download a PowerPoint template file from STHDA website
- Check the available slide layouts in the template file
- Create a PowerPoint document based on the template
Download a template file
# Download a PowerPoint template file from STHDA website
download.file(url="https://www.sthda.com/sthda/RDoc/example-files/r-reporters-powerpoint-template.pptx",
    destfile="r-reporters-powerpoint-template.pptx", quiet=TRUE)
Slide layouts available in the template file
You can use one of the layout below when adding a new slide into the PowerPoint :
doc <- pptx(template="r-reporters-powerpoint-template.pptx")
layouts <-slide.layouts(doc) # All available layout
# Plot the layouts
for(i in layouts ){
  par(mar=c(0.5,0.5,2,0.5), cex=0.7)
  slide.layouts(doc, i )
  title(main = paste0("'", i, "'" ))
  if(interactive()) readline(prompt = "Show next slide layout")
}


Create a PowerPoint document from the template file
Note that, the template file contains already one empty slide which can be removed manually.
library( ReporteRs )
# Download a PowerPoint template file from STHDA website
download.file(url="https://www.sthda.com/sthda/RDoc/example-files/r-reporters-powerpoint-template.pptx",
    destfile="r-reporters-powerpoint-template.pptx", quiet=TRUE)
options('ReporteRs-fontsize'= 18, 'ReporteRs-default-font'='Arial')
doc <- pptx(template="r-reporters-powerpoint-template.pptx" )
# Slide 1 : Title slide
#+++++++++++++++++++++++
doc <- addSlide(doc, "Title Slide")
doc <- addTitle(doc,"Create a PowerPoint from template using R software")
doc <- addSubtitle(doc, "R and ReporteRs package")
doc <- addDate(doc)
doc <- addFooter(doc, "Isaac Newton")
doc <- addPageNumber(doc, "1/4")
# Slide 2 : Add plot
#+++++++++++++++++++++++
doc <- addSlide(doc, "Title and Content")
doc <- addTitle(doc, "Bar plot")
plotFunc<- function(){
  barplot(VADeaths, beside = TRUE,
          col = c("lightblue", "mistyrose", "lightcyan",
                  "lavender", "cornsilk"),
  legend = rownames(VADeaths), ylim = c(0, 100))
  title(main = "Death Rates in Virginia", font.main = 4)
}
doc <- addPlot(doc, plotFunc )
doc <- addPageNumber(doc, "2/4")
# Slide 3 : Add table
#+++++++++++++++++++++++
doc <- addSlide(doc, "Two Content")
doc <- addTitle(doc,"iris data sets")
doc <- addFlexTable(doc, FlexTable(iris[1:4,] ))
doc <- addParagraph(doc, "iris data set gives the measurements in centimeters of the variables sepal length and width and petal length and width, respectively, for 50 flowers from each of 3 species of iris. The species are Iris setosa, versicolor, and virginica.")
doc <- addPageNumber(doc, "3/4")
# Silde 4 : Add R script
#+++++++++++++++++++++
doc <- addSlide(doc, "Content with Caption")
doc <- addTitle(doc, "R Script for histogram plot")
doc <- addPlot(doc, function() hist(iris$Sepal.Width, col=4))
r_code ="data(iris)
hist(iris$Sepal.Width, col = 4)"
doc <- addRScript(doc, text=r_code)
# write the document
writeDoc(doc, "r-reporters-powerpoint-from-template.pptx" )
The PowerPoint document created by the R code above is available here : R software and ReporteRs package - PowerPoint document from template
Infos
This analysis has been performed using R (ver. 3.1.0).
You can read more about ReporteRs and download the source code at the following link :
GitHub (David Gohel): ReporteRs
Show me some love with the like buttons below... Thank you and please don't forget to share and comment below!!
Montrez-moi un peu d'amour avec les like ci-dessous ... Merci et n'oubliez pas, s'il vous plaît, de partager et de commenter ci-dessous!
Recommended for You!


Recommended for you
This section contains the best data science and self-development resources to help you on your path.
Books - Data Science
Our Books
- Practical Guide to Cluster Analysis in R by A. Kassambara (Datanovia)
- Practical Guide To Principal Component Methods in R by A. Kassambara (Datanovia)
- Machine Learning Essentials: Practical Guide in R by A. Kassambara (Datanovia)
- R Graphics Essentials for Great Data Visualization by A. Kassambara (Datanovia)
- GGPlot2 Essentials for Great Data Visualization in R by A. Kassambara (Datanovia)
- Network Analysis and Visualization in R by A. Kassambara (Datanovia)
- Practical Statistics in R for Comparing Groups: Numerical Variables by A. Kassambara (Datanovia)
- Inter-Rater Reliability Essentials: Practical Guide in R by A. Kassambara (Datanovia)
Others
- R for Data Science: Import, Tidy, Transform, Visualize, and Model Data by Hadley Wickham & Garrett Grolemund
- Hands-On Machine Learning with Scikit-Learn, Keras, and TensorFlow: Concepts, Tools, and Techniques to Build Intelligent Systems by Aurelien Géron
- Practical Statistics for Data Scientists: 50 Essential Concepts by Peter Bruce & Andrew Bruce
- Hands-On Programming with R: Write Your Own Functions And Simulations by Garrett Grolemund & Hadley Wickham
- An Introduction to Statistical Learning: with Applications in R by Gareth James et al.
- Deep Learning with R by François Chollet & J.J. Allaire
- Deep Learning with Python by François Chollet
Click to follow us on Facebook :
Comment this article by clicking on "Discussion" button (top-right position of this page)