Correlation coefficient calculator
Correlation test is used to study the dependence between two or more variables. The goal of this article is to describe briefly the different correlation methods and to provide an online correlation coefficient calculator.
The different types of correlation methods
There are :
- the Pearson correlation method which is a parametric correlation test as it depends on the distribution of the data. This method measures the linear dependence between two variables.
- the Kendall and Spearman rank-based correlation analysis (non-parametric methods). These two methods are recommended if the data do not come from a bivariate normal distribution.
Pearson correlation test is the most commonly used method to calculate the correlation coefficient between two variables. The formula is shown in the next section.

Pearson correlation coefficient formula
The Pearson correlation coefficient between two variables, x and y, can be calculated using the formula below :
\[ r = \frac{\sum{(x-m_x)(y-m_y)}}{\sqrt{\sum{(x-mx)^2}\sum{(y-my)^2}}} \]
\(m_x\) and \(m_y\) are the means of x and y variables.
The significance level of the correlation can be determined by reading the table of critical values for the degrees of freedom : \(df = n-2\)
Read more : correlation formula
Calculate the correlation coefficient using R software
Correlation coefficient can be easily computed in R using the function cor() or cor.test(). The simplified formats are :
cor(x, y, method = c("pearson", "kendall", "spearman"))
cor.test(x, y, method=c("pearson", "kendall", "spearman"))
In the R code above x and y are two numeric vectors with the same length.
The main difference between the two correlation functions is that :
- the function cor() returns only the correlation coefficient
- the function cor.test() returns both the correlation coefficient and the significance level(or p-value) of the correlation
These functions can be used as follow :
# Define two numeric vectors
x <- c(44.4, 45.9, 41.9, 53.3, 44.7, 44.1, 50.7, 45.2, 60.1)
y <- c( 2.6,  3.1,  2.5,  5.0,  3.6,  4.0,  5.2,  2.8,  3.8)
# Pearson correlation coefficient between x and y
cor(x, y)
[1] 0.5712# Pearson correlation test
cor.test(x, y)
    Pearson's product-moment correlation
data:  x and y
t = 1.841, df = 7, p-value = 0.1082
alternative hypothesis: true correlation is not equal to 0
95 percent confidence interval:
 -0.1497  0.8956
sample estimates:
   cor
0.5712
The correlation coefficient is 0.5712 and the p-value is 0.1082.
Read more : correlation analysis using R software
Spearman and Kendall non-parametric correlation methods can be used as follow :
# Spearman non-parametric correlation test
cor.test(x, y, method="spearman")
# Kendall non-parametric correlation test
cor.test(x, y, method="kendall")
Interpretation of the correlation coefficient
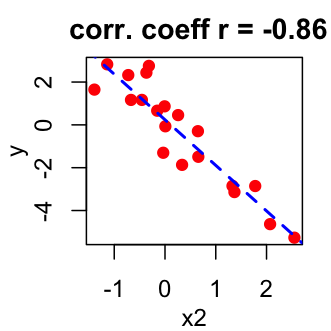
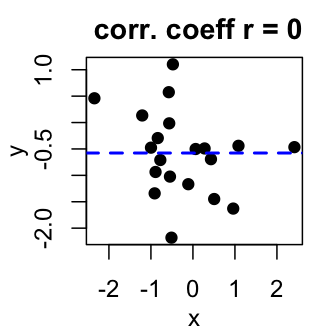
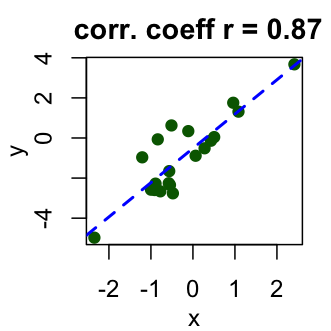
The value of the correlation coefficient is comprised between -1 and 1


- -1 corresponds to a strong negative correlation : this means that every time x increases, y decreases (left panel figure)
- 0 means that there is no association between the two variables (x and y) (middle panel figure)
- 1 corresponds to a strong positive correlation : this means that y increases with x (right panel figure)
Online correlation coefficient calculator
A web application, for computing the different correlation coefficients, is available at this link : correlation coefficient calculator.
It can be used online without any installation to calculate Pearson, Kendall or Spearman correlation coefficient.
Go to the correlation coefficient calculator
The correlation coefficient calculator can be used as follow :
- Go to the application available at this link : correlation coefficient calculator
- Copy and paste your data from Excel to the calculator. You can use the demo data available in the calculator web page by clicking on the link.
- Select the correlation methods (Pearson, Spearman or Kendall). Default is the Pearson method.
- Click the OK button
Note that, you can specify the alternative hypothesis to use for the correlation test by clicking on the button “Advanced options”.
Choose one of the 3 options :
- Two-sided
- Correlation < 0 for “less”
- Correlation > 0 for “greater”
Show me some love with the like buttons below... Thank you and please don't forget to share and comment below!!
Montrez-moi un peu d'amour avec les like ci-dessous ... Merci et n'oubliez pas, s'il vous plaît, de partager et de commenter ci-dessous!
Recommended for You!
Recommended for you
This section contains the best data science and self-development resources to help you on your path.
Books - Data Science
Our Books
- Practical Guide to Cluster Analysis in R by A. Kassambara (Datanovia)
- Practical Guide To Principal Component Methods in R by A. Kassambara (Datanovia)
- Machine Learning Essentials: Practical Guide in R by A. Kassambara (Datanovia)
- R Graphics Essentials for Great Data Visualization by A. Kassambara (Datanovia)
- GGPlot2 Essentials for Great Data Visualization in R by A. Kassambara (Datanovia)
- Network Analysis and Visualization in R by A. Kassambara (Datanovia)
- Practical Statistics in R for Comparing Groups: Numerical Variables by A. Kassambara (Datanovia)
- Inter-Rater Reliability Essentials: Practical Guide in R by A. Kassambara (Datanovia)
Others
- R for Data Science: Import, Tidy, Transform, Visualize, and Model Data by Hadley Wickham & Garrett Grolemund
- Hands-On Machine Learning with Scikit-Learn, Keras, and TensorFlow: Concepts, Tools, and Techniques to Build Intelligent Systems by Aurelien Géron
- Practical Statistics for Data Scientists: 50 Essential Concepts by Peter Bruce & Andrew Bruce
- Hands-On Programming with R: Write Your Own Functions And Simulations by Garrett Grolemund & Hadley Wickham
- An Introduction to Statistical Learning: with Applications in R by Gareth James et al.
- Deep Learning with R by François Chollet & J.J. Allaire
- Deep Learning with Python by François Chollet
Click to follow us on Facebook :
Comment this article by clicking on "Discussion" button (top-right position of this page)


