Add legends to plots in R software : the easiest way!
The goal of this article is to show you how to add legends to plots using R statistical software.
R legend function
To add legends to plots in R, the R legend() function can be used. A simplified format of the function is :
legend(x, y=NULL, legend, fill, col, bg)- x and y : the x and y co-ordinates to be used to position the legend
- legend : the text of the legend
- fill : colors to use for filling the boxes beside the legend text
- col : colors of lines and points beside the legend text
- bg : the background color for the legend box.
Example :
# Generate some data
x<-1:10; y1=x*x; y2=2*y1
plot(x, y1, type="b", pch=19, col="red", xlab="x", ylab="y")
# Add a line
lines(x, y2, pch=18, col="blue", type="b", lty=2)
# Add a legend
legend(1, 95, legend=c("Line 1", "Line 2"),
       col=c("red", "blue"), lty=1:2, cex=0.8)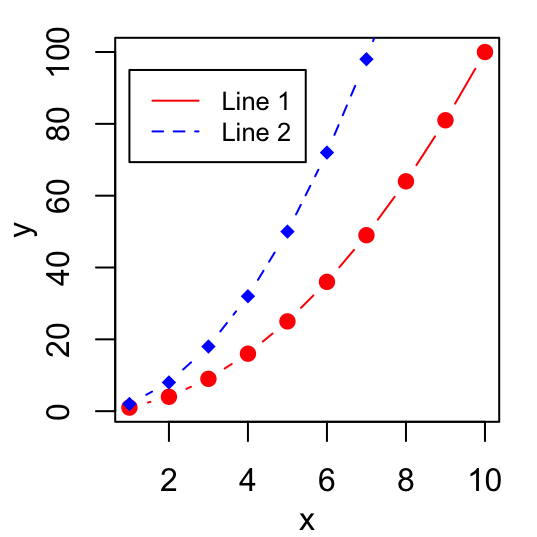
To avoid repeating the above R code, we can create a custom plot function as follow :
makePlot<-function(){
  x<-1:10; y1=x*x; y2=2*y1
  plot(x, y1, type="b", pch=19, col="red", xlab="x", ylab="y")
  lines(x, y2, pch=18, col="blue", type="b", lty=2)
}
Title, text font and background color of the legend box
The arguments below can be used :
- title: The title of the legend
- text.font: an integer specifying the font style of the legend text; possible values are :
- 1: normal
- 2: bold
- 3: italic
- 4: bold and italic
- bg: background color of the legend box
makePlot()
# Add a legend to the plot
legend(1, 95, legend=c("Line 1", "Line 2"),
       col=c("red", "blue"), lty=1:2, cex=0.8,
       title="Line types", text.font=4, bg='lightblue')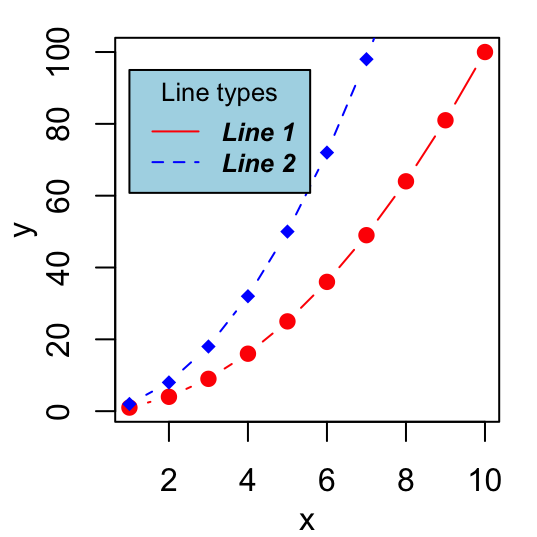
Border of the legend box
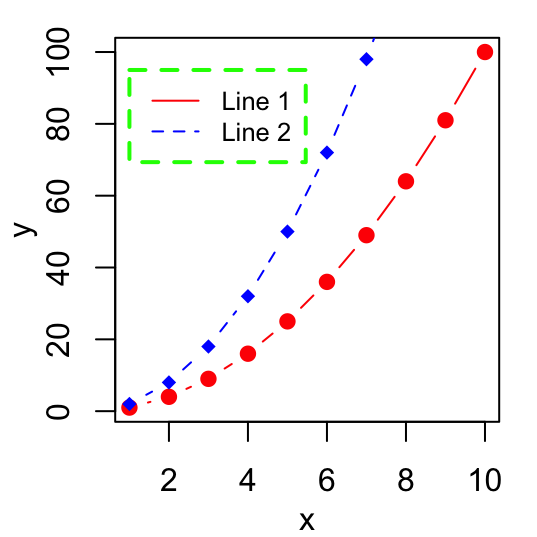
The arguments box.lty, box.lwd and box.col can be used to modify the line type, width and color for the legend box border, respectively.
# Remove legend border using box.lty = 0
makePlot()
legend(1, 95, legend=c("Line 1", "Line 2"),
       col=c("red", "blue"), lty=1:2, cex=0.8,
       box.lty=0)
# Change the border
makePlot()
legend(1, 95, legend=c("Line 1", "Line 2"),
       col=c("red", "blue"), lty=1:2, cex=0.8,
       box.lty=2, box.lwd=2, box.col="green")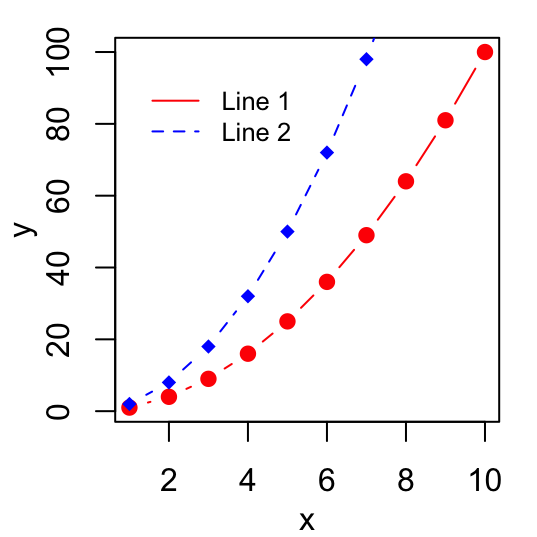
Specify legend position by keywords
The position of the legend can be specified also using the following keywords : "bottomright", "bottom", "bottomleft", "left", "topleft", "top", "topright", "right" and "center".
The effect of using each of these keywords are shown in the figure below :

Example 1: line plot
#  Example 1: line plot
makePlot()
legend("topleft", legend=c("Line 1", "Line 2"),
       col=c("red", "blue"), lty=1:2, cex=0.8)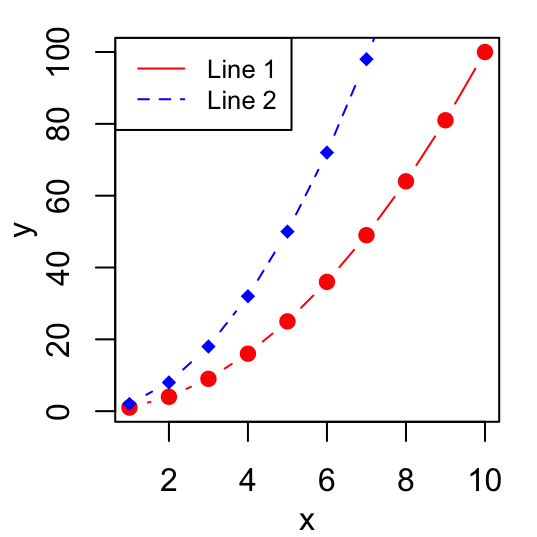
Example 2: box plot
attach(mtcars)
boxplot(mpg~cyl,
        xlab="Cylinders", ylab="Miles/(US) gallon",
        col=topo.colors(3))

legend("bottomleft", inset=.02, title="Number of Cylinders",
   c("4","6","8"), fill=topo.colors(3), horiz=TRUE, cex=0.8)
Note that the argument fill indicates the colors to use for filling the boxes beside the legend text
Infos
This analysis has been performed using R statistical software (ver. 3.1.0).
Show me some love with the like buttons below... Thank you and please don't forget to share and comment below!!
Montrez-moi un peu d'amour avec les like ci-dessous ... Merci et n'oubliez pas, s'il vous plaît, de partager et de commenter ci-dessous!
Recommended for You!
Recommended for you
This section contains the best data science and self-development resources to help you on your path.
Books - Data Science
Our Books
- Practical Guide to Cluster Analysis in R by A. Kassambara (Datanovia)
- Practical Guide To Principal Component Methods in R by A. Kassambara (Datanovia)
- Machine Learning Essentials: Practical Guide in R by A. Kassambara (Datanovia)
- R Graphics Essentials for Great Data Visualization by A. Kassambara (Datanovia)
- GGPlot2 Essentials for Great Data Visualization in R by A. Kassambara (Datanovia)
- Network Analysis and Visualization in R by A. Kassambara (Datanovia)
- Practical Statistics in R for Comparing Groups: Numerical Variables by A. Kassambara (Datanovia)
- Inter-Rater Reliability Essentials: Practical Guide in R by A. Kassambara (Datanovia)
Others
- R for Data Science: Import, Tidy, Transform, Visualize, and Model Data by Hadley Wickham & Garrett Grolemund
- Hands-On Machine Learning with Scikit-Learn, Keras, and TensorFlow: Concepts, Tools, and Techniques to Build Intelligent Systems by Aurelien Géron
- Practical Statistics for Data Scientists: 50 Essential Concepts by Peter Bruce & Andrew Bruce
- Hands-On Programming with R: Write Your Own Functions And Simulations by Garrett Grolemund & Hadley Wickham
- An Introduction to Statistical Learning: with Applications in R by Gareth James et al.
- Deep Learning with R by François Chollet & J.J. Allaire
- Deep Learning with Python by François Chollet
Click to follow us on Facebook :
Comment this article by clicking on "Discussion" button (top-right position of this page)


