Saving High-Resolution ggplots: How to Preserve Semi-Transparency
This article describes solutions for preserving semi-transparency when saving a ggplot2-based graphs into a high quality postscript (.eps) file format.

Contents:
Create a ggplot with semi-transparent color
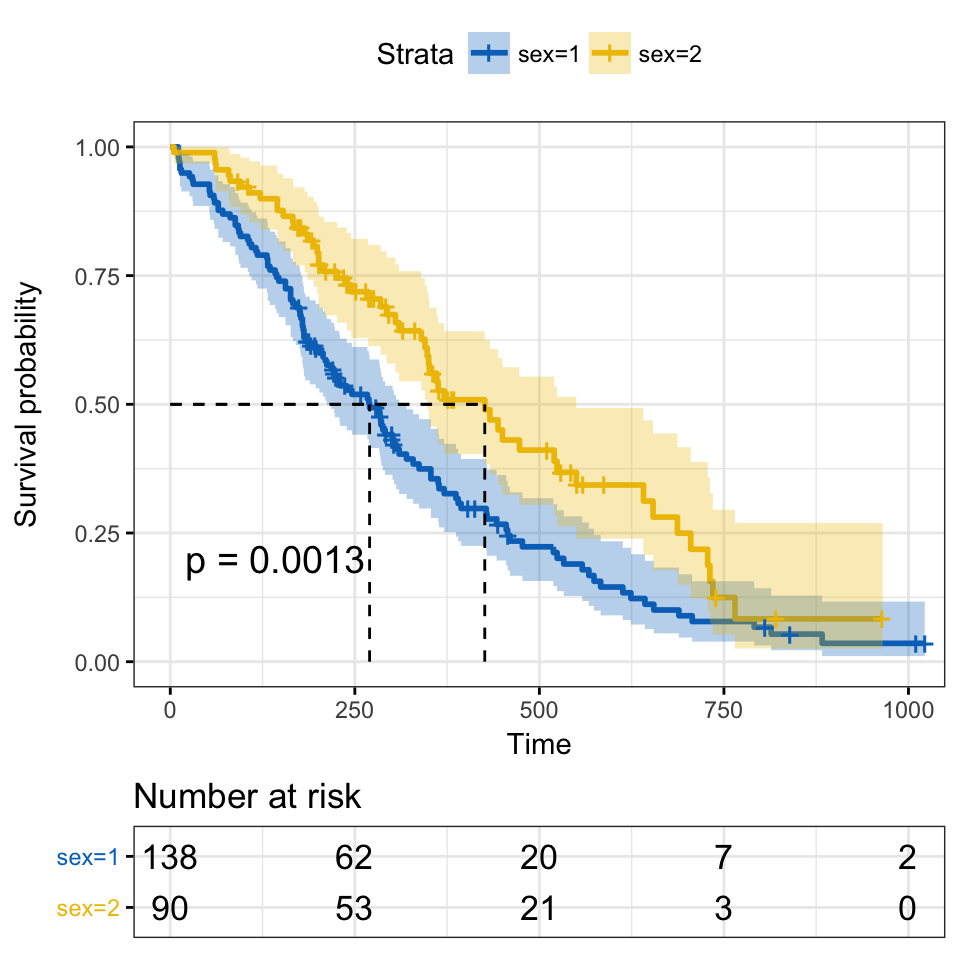
To illustrate this, we start by creating ggplot2-based survival curves using the function ggsurvplot() in the survminer package. The ggsurvplot() function creates survival curves with the 95% confidence bands in a semi-transparent color.
First install (if needed) survminer as follow:
install.packages("survminer")Then type, this:
# Fit survival curves
require("survival")
fit<- survfit(Surv(time, status) ~ sex, data = lung)
# Visualize
library("survminer")
p <- ggsurvplot(fit, data = lung,
         surv.median.line = "hv", # Add medians survival
         pval = TRUE,             # Add p-value and tervals

         conf.int = TRUE,        # Add the 95% confidence band
         risk.table = TRUE,      # Add risk table
         tables.height = 0.2,
         tables.theme = theme_cleantable(),
         palette = "jco",
         ggtheme = theme_bw()
    )
print(p)
In the plot above, the confidence band is semi-transparent. It can be saved to a PDF file without loosing the semi-transparent color.
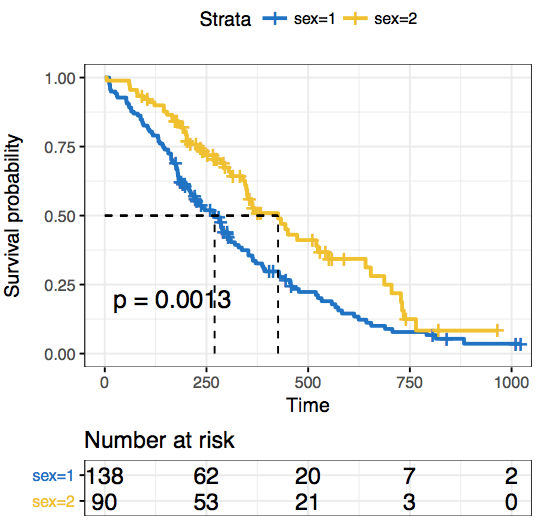
If you try to export the picture as vector file (EPS ), the 95% confidence interval will disappear and the saved plot looks as follow:

The problem is that EPS in R does not support transparency.
A simple alternative is to export the plot into SVG file format. In the following sections, we’ll describe convenient solutions to save high-quality ggplots by preserving semi-transparency.
Save ggplots with semi-transparent colors
Use cairo-based postscript graphics devices
You can use the ggsave() function in [ggplot2] as follow:
ggsave(filename = "survival-curves.eps",
       plot = print(p),
       device = cairo_eps)
Or use this:
cairo_ps(filename = "survival-curves.eps",
         width = 7, height = 7, pointsize = 12,
         fallback_resolution = 300)
print(p)
dev.off()
Note that, the argument fallback_resolution is used to control the resolution in dpi at which semi-transparent areas are rasterized (the rest stays as vector format).
Export to powerpoint
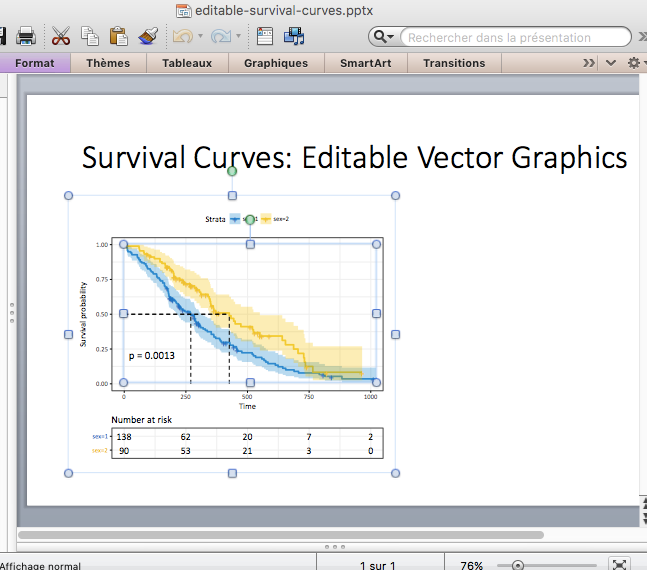
You can export the plot to Powerpoint using the ReporteRs package. ReporteRs will give you a fully editable vector format with full support for transparency as well.
We previously described how to Create and format PowerPoint documents from R software using the ReporteRs package. We also described how to export an editable ggplot from R software to powerpoint.
Briefly, to export our survival curves from R to powerpoint, the script looks like this
library('ReporteRs')
# Create a new powerpoint document
doc <- pptx()
# Add a new slide into the ppt document
doc <- addSlide(doc, slide.layout = "Two Content"  )
# Add a slide title
doc <- addTitle(doc, "Survival Curves: Editable Vector Graphics" )
# Print the survival curves in the powerpoint
doc <- addPlot(doc, function() print(p, newpage = FALSE),
               vector.graphic = TRUE  # Make it editable
               )
# write the document to a file
writeDoc(doc, file = "editable-survival-curves.pptx")
The output looks like this:

Edit the plot in powerpoint. See the video below: Editing ggplots Exported with ReporteRs into PWPT
Infos
Show me some love with the like buttons below... Thank you and please don't forget to share and comment below!!
Montrez-moi un peu d'amour avec les like ci-dessous ... Merci et n'oubliez pas, s'il vous plaît, de partager et de commenter ci-dessous!
Recommended for You!
Recommended for you
This section contains the best data science and self-development resources to help you on your path.
Books - Data Science
Our Books
- Practical Guide to Cluster Analysis in R by A. Kassambara (Datanovia)
- Practical Guide To Principal Component Methods in R by A. Kassambara (Datanovia)
- Machine Learning Essentials: Practical Guide in R by A. Kassambara (Datanovia)
- R Graphics Essentials for Great Data Visualization by A. Kassambara (Datanovia)
- GGPlot2 Essentials for Great Data Visualization in R by A. Kassambara (Datanovia)
- Network Analysis and Visualization in R by A. Kassambara (Datanovia)
- Practical Statistics in R for Comparing Groups: Numerical Variables by A. Kassambara (Datanovia)
- Inter-Rater Reliability Essentials: Practical Guide in R by A. Kassambara (Datanovia)
Others
- R for Data Science: Import, Tidy, Transform, Visualize, and Model Data by Hadley Wickham & Garrett Grolemund
- Hands-On Machine Learning with Scikit-Learn, Keras, and TensorFlow: Concepts, Tools, and Techniques to Build Intelligent Systems by Aurelien Géron
- Practical Statistics for Data Scientists: 50 Essential Concepts by Peter Bruce & Andrew Bruce
- Hands-On Programming with R: Write Your Own Functions And Simulations by Garrett Grolemund & Hadley Wickham
- An Introduction to Statistical Learning: with Applications in R by Gareth James et al.
- Deep Learning with R by François Chollet & J.J. Allaire
- Deep Learning with Python by François Chollet
Click to follow us on Facebook :
Comment this article by clicking on "Discussion" button (top-right position of this page)


