


Create an editable graph from R software
In this article you’ll learn how to create an editable vector graphics from R software. This could be interesting in some cases and gives you the ability to edit your graphics from PowerPoint. You can change line types, colors, point shapes, etc, …
Who is this article for ?
If you want to export your plot from R to PowerPoint automatically, this is for you.
If you want to bring your ggplot2 charts to PowerPoint, then this guide is for you.
If you’re looking for an exact package to create an editable plot and to save it as a PowerPoint document, then you’ll love this tutorial.
If you’re a beginner in R programming, you’ll definitely learn something new that you can use if needed.
What R package to use ?
Editable vector graphics can be created and saved in a PowerPoint document using ReporteRs package.
Install and load the package as follow :
install.packages('ReporteRs') # Install
library('ReporteRs') # Load
Create editable plots
Case of base graphs
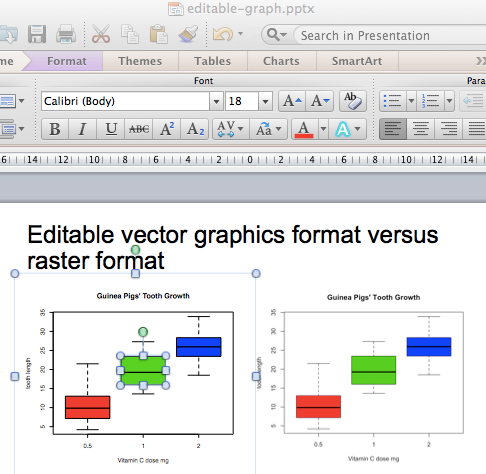
The example below creates a PowerPoint document in your current working directory. The document contains one slide with 2 panels :
- The first panel contains an editable box plot
- The second panel contains a raster format
The PowerPoint document created by the R code below is available here : R software and ReporteRs package - create an editable base graph
library('ReporteRs')
# Create a new powerpoint document
doc <- pptx()
# Add a new slide into the ppt document
doc <- addSlide(doc, "Two Content" )
# add a slide title
doc<- addTitle(doc, "Editable vector graphics format versus raster format" )
# A function for creating a box plot
boxplotFunc<- function(){
      boxplot(len ~ dose, data = ToothGrowth,
        col=2:4,main = "Guinea Pigs' Tooth Growth",
        xlab = "Vitamin C dose mg",
        ylab = "tooth length")
      }
# Add an editable box plot
doc <- addPlot(doc, boxplotFunc, vector.graphic = TRUE )
# Add a raster box plot
doc <- addPlot(doc, boxplotFunc, vector.graphic = FALSE )
# write the document to a file
writeDoc(doc, file = "editable-graph.pptx")
Open the created PowerPoint and try to edit the first box plot by changing the fill colors, line types, etc…
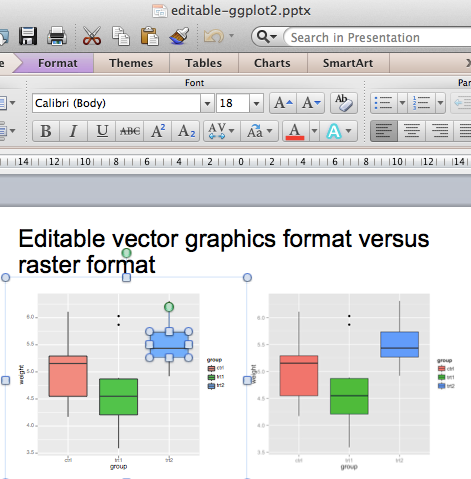
Case of graphs generated using ggplot2
ggplot2 is a powerful R package, implemented by Hadley Wickham, for producing a visually appealing charts.
Install and load it as follow :
install.packages('ggplot2') # Install
library('ggplot2') # Load
Create an editable plot with ggplot2 :
library('ReporteRs')
library(ggplot2)
# Create a new powerpoint document
doc <- pptx()
# Add a new slide into the ppt document
doc <- addSlide(doc, "Two Content" )
# add a slide title
doc<- addTitle(doc, "Editable vector graphics format versus raster format" )
# A function for creating a box plot
bp <- ggplot(data=PlantGrowth, aes(x=group, y=weight, fill=group))+
        geom_boxplot()
# Add an editable box plot
doc <- addPlot(doc, function() print(bp), vector.graphic = TRUE )
# Add a raster box plot
doc <- addPlot(doc, function() print(bp), vector.graphic = FALSE )
# write the document to a file
writeDoc(doc, file = "editable-ggplot2.pptx")
The PowerPoint document created by the R code above is available here : R software and ReporteRs package - create an editable ggplot2
Infos
This analysis has been performed using R (ver. 3.1.0).
You can read more about ReporteRs and download the source code at the following link :
GitHub (David Gohel): ReporteRs
Show me some love with the like buttons below... Thank you and please don't forget to share and comment below!!
Montrez-moi un peu d'amour avec les like ci-dessous ... Merci et n'oubliez pas, s'il vous plaît, de partager et de commenter ci-dessous!
Recommended for You!


Recommended for you
This section contains the best data science and self-development resources to help you on your path.
Books - Data Science
Our Books
- Practical Guide to Cluster Analysis in R by A. Kassambara (Datanovia)
- Practical Guide To Principal Component Methods in R by A. Kassambara (Datanovia)
- Machine Learning Essentials: Practical Guide in R by A. Kassambara (Datanovia)
- R Graphics Essentials for Great Data Visualization by A. Kassambara (Datanovia)
- GGPlot2 Essentials for Great Data Visualization in R by A. Kassambara (Datanovia)
- Network Analysis and Visualization in R by A. Kassambara (Datanovia)
- Practical Statistics in R for Comparing Groups: Numerical Variables by A. Kassambara (Datanovia)
- Inter-Rater Reliability Essentials: Practical Guide in R by A. Kassambara (Datanovia)
Others
- R for Data Science: Import, Tidy, Transform, Visualize, and Model Data by Hadley Wickham & Garrett Grolemund
- Hands-On Machine Learning with Scikit-Learn, Keras, and TensorFlow: Concepts, Tools, and Techniques to Build Intelligent Systems by Aurelien Géron
- Practical Statistics for Data Scientists: 50 Essential Concepts by Peter Bruce & Andrew Bruce
- Hands-On Programming with R: Write Your Own Functions And Simulations by Garrett Grolemund & Hadley Wickham
- An Introduction to Statistical Learning: with Applications in R by Gareth James et al.
- Deep Learning with R by François Chollet & J.J. Allaire
- Deep Learning with Python by François Chollet
Click to follow us on Facebook :
Comment this article by clicking on "Discussion" button (top-right position of this page)