


Add a table into a Word document using R software and ReporteRs package
The ReporteRs package is used to create a Word document from R software. The function addFlexTable() can be used to add a simple or customized table into the document.
- The first step is to create a table using one of the functions below :
- FlexTable() to create a ‘flexible’ table which can be easily formatted
- vanilla.table() which is shortcut to quickly produce a nice FlexTable
- The second step is to add the created table into the Word document using addFlexTable() function as follow :
# doc : docx object
# flextable : FlexTable object
addFlexTable(doc, flextable)
The aim of this R tutorial is to show you step by step, how to add simple and formatted table into a Word document.
In the following examples, we’ll add the first 5 rows of iris data sets into the Word document.
data<-iris[1:5, ]
data
Sepal.Length Sepal.Width Petal.Length Petal.Width Species
1 5.1 3.5 1.4 0.2 setosa
2 4.9 3.0 1.4 0.2 setosa
3 4.7 3.2 1.3 0.2 setosa
4 4.6 3.1 1.5 0.2 setosa
5 5.0 3.6 1.4 0.2 setosaAdd a simple table
library(ReporteRs)
doc <- docx()
data<-iris[1:5, ]
# Add a first table : Default table
doc <- addTitle(doc, "Default table")
doc <- addFlexTable( doc, FlexTable(data))
doc <- addParagraph(doc, c("", "")) # 2 line breaks
# Add a second table, theme : vanilla table
doc <- addTitle(doc, "Vanilla table")
doc <- addFlexTable( doc, vanilla.table(data))
writeDoc(doc, file = "r-reporters-word-document-add-table.docx")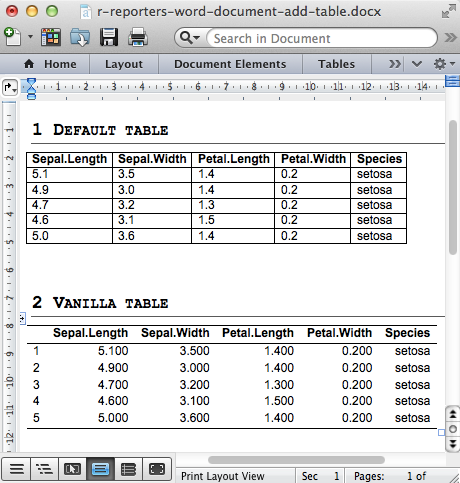
An optional argument of addFlextable() function is par.properties which value can be parRight(), parLeft(), parJustify() for the table alignments. It can be used as follow :
doc <- addFlexTable( doc, vanilla.table(data),
                     par.properties = parCenter())
Note also that, row names are not shown by default when FlexTable() function is used to create a table. To make row names visible use the function as follow :
doc <- addFlexTable( doc, FlexTable(data, row.names=TRUE))Add a formatted table
Change the background colors of rows and columns
You should know three functions to change the appearance of table rows and columns :
- setZebraStyle() : to color odd and even rows differently; for example, odd rows in gray color and even rows in white color.
- setRowsColors() : to change color of a particular table row
- setColumnsColors : to change the color of particular table columns
These functions can be used as follow :
library(ReporteRs)
doc <- docx()
data<-iris[1:5, ]
# Zebra striped tables
doc <- addTitle(doc, "Zebra striped tables")
MyFTable <- vanilla.table(data)
MyFTable <- setZebraStyle(MyFTable, odd = '#eeeeee', even = 'white')
doc <- addFlexTable( doc, MyFTable)
# Change columns and rows background colors
doc <- addTitle(doc, "Change columns and rows background colors")
MyFTable = FlexTable(data = data )
# i : row index; j : column index
MyFTable = setRowsColors(MyFTable, i=2:3, colors = 'lightblue')
MyFTable = setColumnsColors(MyFTable, j=3, colors = 'pink' )
doc <- addFlexTable(doc, MyFTable)
writeDoc(doc, file = "r-reporters-word-document-formatted-table1.docx")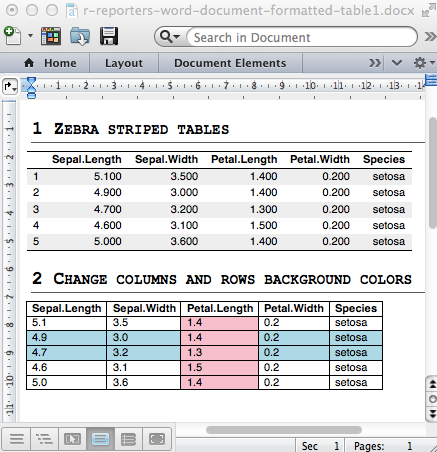
Note that, i and j are, respectively, the index of rows and column to change
Change cell background and text colors
We can change the background colors of some cells according to their values using the function setFlexTableBackgroundColors().
As an example, We’ll set up the background color of column 2 according to the value of the Sepal.Width variable (iris data sets) :
- Cells with Sepal.Width < 3.2 are colored in gray (“#DDDDDD”)
- Cells with Sepal.Width > = 3.2 are colored in “orange”
The text values of the table cells can be also customized as demonstrated in the example below :
library(ReporteRs)
doc <- docx()
data<-iris[1:5, ]
# Change the background colors of column 2 according to Sepal.Width
#++++++++++++++++++++++++++++
doc <- addTitle(doc, "Change the background color of cells")
MyFTable <- FlexTable(data)
MyFTable <- setFlexTableBackgroundColors(MyFTable, j = 2,
  colors = ifelse(data$Sepal.Width < 3.2, '#DDDDDD', 'orange'))
doc <- addFlexTable( doc, MyFTable)
# Format the text of some cells (column 3:4)
#++++++++++++++++++++++++++++
doc <- addTitle(doc, "Format cell text values")
MyFTable = FlexTable(data)
MyFTable[, 3:4] = textProperties(color = 'blue')
doc <- addFlexTable( doc, MyFTable)
writeDoc(doc, file = "r-reporters-word-document-format-cells.docx")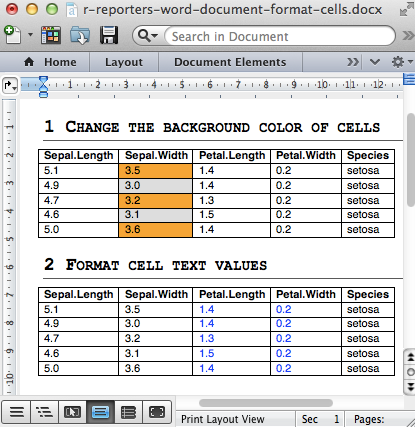
Insert content into a table : header and footer rows
Additional rows, such as header and footer, can be easily added into a table as illustrated in the example hereafter. Contents can be also added in a particular cell.
The functions addHeaderRow() and addFooterRow() are used to add a header and a footer.
A simplified format of these functions are :
addHeaderRow(x, value, colspan, text.properties)
addFooterRow(x, value, colspan, text.properties)- x : a FlexTable object
- value : character vector to add as a header or a footer
- colspan : a numeric vector (optional) specifying the number of columns to span for each corresponding value
- text.properties : the text properties to apply to each cell (optional).
library(ReporteRs)
doc <- docx()
data<-iris[1:5, ]
# Insert a content into a table
doc <- addTitle(doc, "Insert a content")
MyFTable = FlexTable(data, header.columns= FALSE )
# Add first header row
MyFTable <- addHeaderRow( MyFTable,
            value = c('Sepal', 'Petal', 'Species'),
            text.properties = textBold(color="orange"),
            colspan = c( 2, 2, 1))
# Add second header row
MyFTable = addHeaderRow(MyFTable, value = names(data),
  text.properties = textBold())

# Add footer row
MyFTable <- addFooterRow(MyFTable,
              value = 'This data is from iris data sets',
              colspan = 5,
              text.properties = textBoldItalic(color ="blue"))
# Add symbol
MyFTable[data$Petal.Length!=1.4, 'Species',
  text.properties = textBold(vertical.align = 'superscript',
                             color = "red")] = '(1)'
doc <- addFlexTable( doc, MyFTable)
writeDoc(doc, file = "r-reporters-word-document-add-header-footer.docx")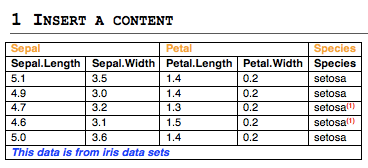
Analyze, format and export a correlation matrix into a Word document
library(ReporteRs)
doc <- docx()
data( mtcars )
cormatrix = cor(mtcars)
col =c("#B2182B", "#D6604D", "#F4A582", "#FDDBC7",
       "#D1E5F0", "#92C5DE", "#4393C3", "#2166AC")
mycut = cut(cormatrix,
        breaks = c(-1,-0.75,-0.5,-0.25,0,0.25,0.5,0.75,1),
        include.lowest = TRUE, label = FALSE )
color_palettes = col[mycut]
corrFT = FlexTable( round(cormatrix, 2), add.rownames = TRUE )
corrFT = setFlexTableBackgroundColors(corrFT,
        j = seq_len(ncol(cormatrix)) + 1,
        colors = color_palettes )
corrFT = setFlexTableBorders( corrFT
        , inner.vertical = borderProperties( style = "dashed", color = "white" )
        , inner.horizontal = borderProperties( style = "dashed", color = "white"  )
        , outer.vertical = borderProperties( width = 2, color = "white"  )
        , outer.horizontal = borderProperties( width = 2, color = "white"  )
)
doc <- addFlexTable( doc, corrFT)
writeDoc(doc, file = "r-reporters-word-document-correlation.docx")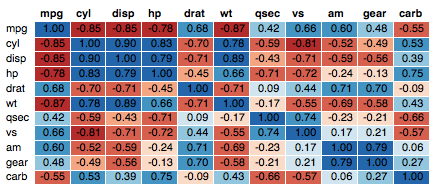
Powerpoint
A pptx object works the same but does not require any parProperties
Infos
This analysis has been performed using R (ver. 3.2.3).
Show me some love with the like buttons below... Thank you and please don't forget to share and comment below!!
Montrez-moi un peu d'amour avec les like ci-dessous ... Merci et n'oubliez pas, s'il vous plaît, de partager et de commenter ci-dessous!
Recommended for You!


Recommended for you
This section contains the best data science and self-development resources to help you on your path.
Books - Data Science
Our Books
- Practical Guide to Cluster Analysis in R by A. Kassambara (Datanovia)
- Practical Guide To Principal Component Methods in R by A. Kassambara (Datanovia)
- Machine Learning Essentials: Practical Guide in R by A. Kassambara (Datanovia)
- R Graphics Essentials for Great Data Visualization by A. Kassambara (Datanovia)
- GGPlot2 Essentials for Great Data Visualization in R by A. Kassambara (Datanovia)
- Network Analysis and Visualization in R by A. Kassambara (Datanovia)
- Practical Statistics in R for Comparing Groups: Numerical Variables by A. Kassambara (Datanovia)
- Inter-Rater Reliability Essentials: Practical Guide in R by A. Kassambara (Datanovia)
Others
- R for Data Science: Import, Tidy, Transform, Visualize, and Model Data by Hadley Wickham & Garrett Grolemund
- Hands-On Machine Learning with Scikit-Learn, Keras, and TensorFlow: Concepts, Tools, and Techniques to Build Intelligent Systems by Aurelien Géron
- Practical Statistics for Data Scientists: 50 Essential Concepts by Peter Bruce & Andrew Bruce
- Hands-On Programming with R: Write Your Own Functions And Simulations by Garrett Grolemund & Hadley Wickham
- An Introduction to Statistical Learning: with Applications in R by Gareth James et al.
- Deep Learning with R by François Chollet & J.J. Allaire
- Deep Learning with Python by François Chollet
Click to follow us on Facebook :
Comment this article by clicking on "Discussion" button (top-right position of this page)