


Predict in R: Model Predictions and Confidence Intervals
The main goal of linear regression is to predict an outcome value on the basis of one or multiple predictor variables.
In this chapter, we’ll describe how to predict outcome for new observations data using R.. You will also learn how to display the confidence intervals and the prediction intervals.
Contents:

Build a linear regression
We start by building a simple linear regression model that predicts the stopping distances of cars on the basis of the speed.
# Load the data
data("cars", package = "datasets")
# Build the model
model <- lm(dist ~ speed, data = cars)
model
##
## Call:
## lm(formula = dist ~ speed, data = cars)
##
## Coefficients:
## (Intercept) speed
## -17.58 3.93The linear model equation can be written as follow: dist = -17.579 + 3.932*speed.
Note that, the units of the variable speed and dist are respectively, mph and ft.
Prediction for new data set
Using the above model, we can predict the stopping distance for a new speed value.
Start by creating a new data frame containing, for example, three new speed values:
new.speeds <- data.frame(
  speed = c(12, 19, 24)
)
You can predict the corresponding stopping distances using the R function predict() as follow:
predict(model, newdata = new.speeds)## 1 2 3
## 29.6 57.1 76.8Confidence interval
The confidence interval reflects the uncertainty around the mean predictions. To display the 95% confidence intervals around the mean the predictions, specify the option interval = "confidence":
predict(model, newdata = new.speeds, interval = "confidence")## fit lwr upr
## 1 29.6 24.4 34.8
## 2 57.1 51.8 62.4
## 3 76.8 68.4 85.2The output contains the following columns:
fit: the predicted sale values for the three new advertising budgetlwrandupr: the lower and the upper confidence limits for the expected values, respectively. By default the function produces the 95% confidence limits.
For example, the 95% confidence interval associated with a speed of 19 is (51.83, 62.44). This means that, according to our model, a car with a speed of 19 mph has, on average, a stopping distance ranging between 51.83 and 62.44 ft.
Prediction interval
The prediction interval gives uncertainty around a single value. In the same way, as the confidence intervals, the prediction intervals can be computed as follow:
predict(model, newdata = new.speeds, interval = "prediction")## fit lwr upr
## 1 29.6 -1.75 61.0
## 2 57.1 25.76 88.5
## 3 76.8 44.75 108.8The 95% prediction intervals associated with a speed of 19 is (25.76, 88.51). This means that, according to our model, 95% of the cars with a speed of 19 mph have a stopping distance between 25.76 and 88.51.
Note that, prediction interval relies strongly on the assumption that the residual errors are normally distributed with a constant variance. So, you should only use such intervals if you believe that the assumption is approximately met for the data at hand.
Prediction interval or confidence interval?
A prediction interval reflects the uncertainty around a single value, while a confidence interval reflects the uncertainty around the mean prediction values. Thus, a prediction interval will be generally much wider than a confidence interval for the same value.
Which one should we use? The answer to this question depends on the context and the purpose of the analysis. Generally, we are interested in specific individual predictions, so a prediction interval would be more appropriate. Using a confidence interval when you should be using a prediction interval will greatly underestimate the uncertainty in a given predicted value (P. Bruce and Bruce 2017).
The R code below creates a scatter plot with:
- The regression line in blue
- The confidence band in gray
- The prediction band in red
# 0. Build linear model
data("cars", package = "datasets")
model <- lm(dist ~ speed, data = cars)
# 1. Add predictions
pred.int <- predict(model, interval = "prediction")
mydata <- cbind(cars, pred.int)
# 2. Regression line + confidence intervals
library("ggplot2")
p <- ggplot(mydata, aes(speed, dist)) +
  geom_point() +
  stat_smooth(method = lm)
# 3. Add prediction intervals
p + geom_line(aes(y = lwr), color = "red", linetype = "dashed")+
    geom_line(aes(y = upr), color = "red", linetype = "dashed")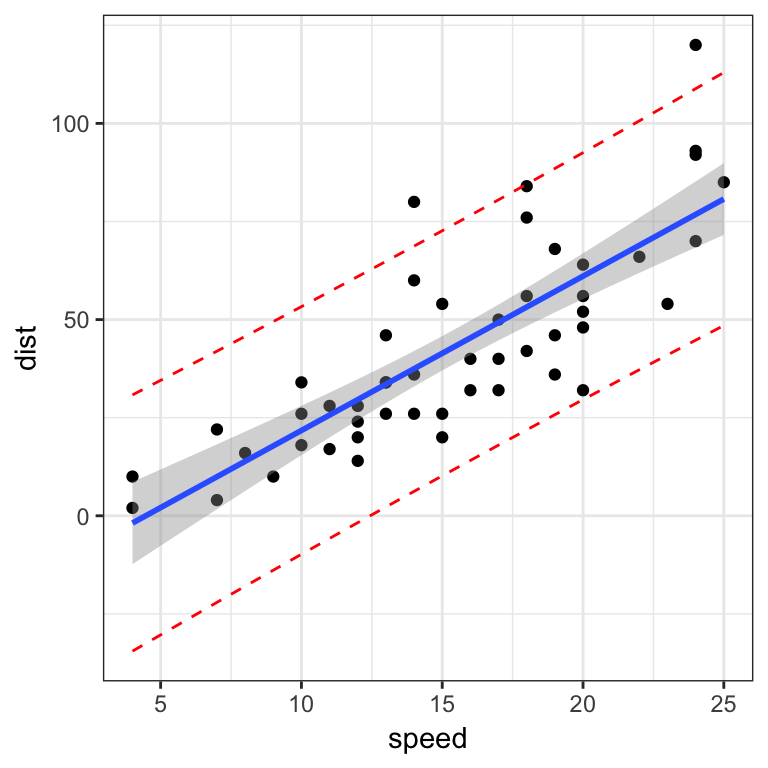
Discussion
In this chapter, we have described how to use the R function predict() for predicting outcome for new data.
References
Bruce, Peter, and Andrew Bruce. 2017. Practical Statistics for Data Scientists. O’Reilly Media.