


Network Analysis and Manipulation using R
This chapter describes how to manipulate and analyze a network graph in R using the tidygraph package.
The tidygraph package provides a tidy framework to easily manipulate different types of relational data, including: graph, network and trees.
In the tidygraph framework, network data are considered as two tidy data tables, one describing the node data and the other is for edge data. The package provides a simple solution to switch between the two tables and provides dplyr verbs for manipulating them.
You will learn methods for detecting important or central entities in a network graph. We’ll also introduce how to detect community (or cluster) in a network.
Contents:

Load required packages
tidyversefor general data manipulation and visualization.tidygraphfor manipulating and analyzing network graphs.ggraphfor visualizing network objects created using the tidygraph package.
library(tidyverse)
library(tidygraph)
library(ggraph)
Create network objects
Key R functions:
tbl_graph(). Creates a network object from nodes and edges dataas_tbl_graph(). Converts network data and objects to a tbl_graph network.
Demo data set: phone.call2 data [in the navdata R package], which is a list containing the nodes and the edges list prepared in the chapter @ref(network-visualization-essentials).
Use tbl_graph
- Create a tbl_graph network object using the phone call data:
library("navdata")
data("phone.call2")
phone.net <- tbl_graph(
  nodes = phone.call2$nodes,
  edges = phone.call2$edges,
  directed = TRUE
)- Visualize:
ggraph(phone.net, layout = "graphopt") +
  geom_edge_link(width = 1, colour = "lightgray") +
  geom_node_point(size = 4, colour = "#00AFBB") +
  geom_node_text(aes(label = label), repel = TRUE)+
  theme_graph()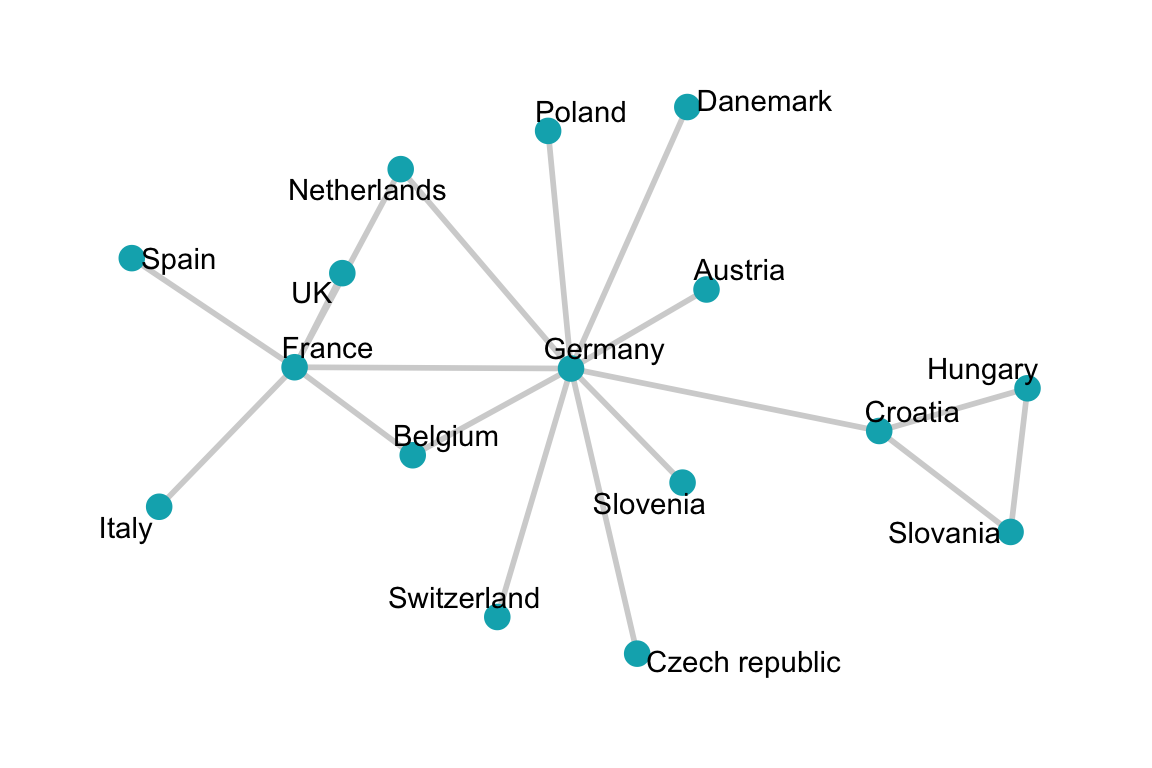
Use as_tbl_graph R function
One can also use the as_tbl_graph() function to converts the following data structure and network objects:
data.frame,listandmatrixdata [R base]igraphnetwork objects [igraph package]networknetwork objects [network pakage]dendrogramandhclust[stats package]Node[data.tree package]phyloandevonet[ape package]graphNEL,graphAM,graphBAM[graph package (in Bioconductor)]
In the following example, we’ll create a correlation matrix network graph. The mtcars data set will be used.
Compute the correlation matrix between cars using the corrr package:
- Use the mtcars data set
- Compute the correlation matrix:
correlate()
- Compute the correlation matrix:
- Convert the upper triangle to NA:
shave()
- Convert the upper triangle to NA:
- Stretch the correlation data frame into long format
- Keep only high correlation
library(corrr)
res.cor <- mtcars [, c(1, 3:6)] %>%  # (1)
  t() %>% correlate() %>%            # (2)
  shave(upper = TRUE) %>%            # (3)
  stretch(na.rm = TRUE) %>%          # (4)
  filter(r >= 0.998)                 # (5)
res.cor
## # A tibble: 59 x 3
## x y r
##
## 1 Mazda RX4 Mazda RX4 Wag 1.000
## 2 Mazda RX4 Merc 230 1.000
## 3 Mazda RX4 Merc 280 0.999
## 4 Mazda RX4 Merc 280C 0.999
## 5 Mazda RX4 Merc 450SL 0.998
## 6 Mazda RX4 Wag Merc 230 1.000
## # ... with 53 more rows Create the correlation network graph:
set.seed(1)
cor.graph <- as_tbl_graph(res.cor, directed = FALSE)
ggraph(cor.graph) +
  geom_edge_link() +
  geom_node_point() +
  geom_node_text(
    aes(label = name), size = 3, repel = TRUE
    ) +
  theme_graph()
Print out a network object
cor.graph## # A tbl_graph: 24 nodes and 59 edges
## #
## # An undirected simple graph with 3 components
## #
## # Node Data: 24 x 1 (active)
## name
##
## 1 Mazda RX4
## 2 Mazda RX4 Wag
## 3 Datsun 710
## 4 Hornet 4 Drive
## 5 Hornet Sportabout
## 6 Valiant
## # ... with 18 more rows
## #
## # Edge Data: 59 x 3
## from to r
##
## 1 1 2 1.000
## 2 1 20 1.000
## 3 1 8 0.999
## # ... with 56 more rows The output shows:
- a tbl_graph object with 24 nodes and 59 edges. Nodes are the car names and the edges are the correlation links.
- the first six rows of “Node Data”" and the first three of “Edge Data”.
- that the Node Data is active.
The notion of an active tibble within a tbl_graph object makes it possible to manipulate the data in one tibble at a time. The nodes tibble is activated by default, but you can change which tibble is active with the activate() function.
If you want to rearrange the rows in the edges tibble to list those with the highest “r” first, you could use activate() and then arrange(). For example, type the following R code:
cor.graph %>%
  activate(edges) %>%
  arrange(desc(r))
Note that, to extract the current active data as a tibble, you can use the function as_tibble(cor.graph).
Network graph manipulation
With the tidygraph package, you can easily manipulate the nodes and the edges data in the network graph object using dplyr verbs. For example, you can add new columns or rename columns in the nodes/edges data.
You can also filter and arrange the data. Note that, applying filter()/slice() on node data will remove the edges terminating at the removed nodes.
In this section we’ll manipulate the correlation network graph.
- Modify the nodes data:
- Group the cars by the “cyl” variable (number of cylinders) in the original mtcars data set. We’ll color the cars by groups.
- Join the group info to the nodes data
- Rename the column “name”, in the nodes data, to “label”
You can use the dplyr verbs as follow:
# Car groups info
cars.group <- data_frame(
  name = rownames(mtcars),
  cyl = as.factor(mtcars$cyl)
)
# Modify the nodes data
cor.graph <- cor.graph %>%
  activate(nodes) %>%
  left_join(cars.group, by = "name") %>%
rename(label = name)- Modify the edge data. Rename the column “r” to “weight”.
cor.graph <- cor.graph %>%
  activate(edges) %>%
rename(weight = r)- Display the final modified graphs object:
cor.graph## # A tbl_graph: 24 nodes and 59 edges
## #
## # An undirected simple graph with 3 components
## #
## # Edge Data: 59 x 3 (active)
## from to weight
##
## 1 1 2 1.000
## 2 1 20 1.000
## 3 1 8 0.999
## 4 1 9 0.999
## 5 1 11 0.998
## 6 2 20 1.000
## # ... with 53 more rows
## #
## # Node Data: 24 x 2
## label cyl
##
## 1 Mazda RX4 6
## 2 Mazda RX4 Wag 6
## 3 Datsun 710 4
## # ... with 21 more rows - Visualize the correlation network.
- Change the edges width according to the variable weight
- Scale the edges width by setting the minimum width to 0.2 and the maximum to 1.
- Change the color of cars (nodes) according to the grouping variable cyl.
set.seed(1)
ggraph(cor.graph) +
  geom_edge_link(aes(width = weight), alpha = 0.2) +
  scale_edge_width(range = c(0.2, 1)) +
  geom_node_point(aes(color = cyl), size = 2) +
  geom_node_text(aes(label = label), size = 3, repel = TRUE) +
  theme_graph()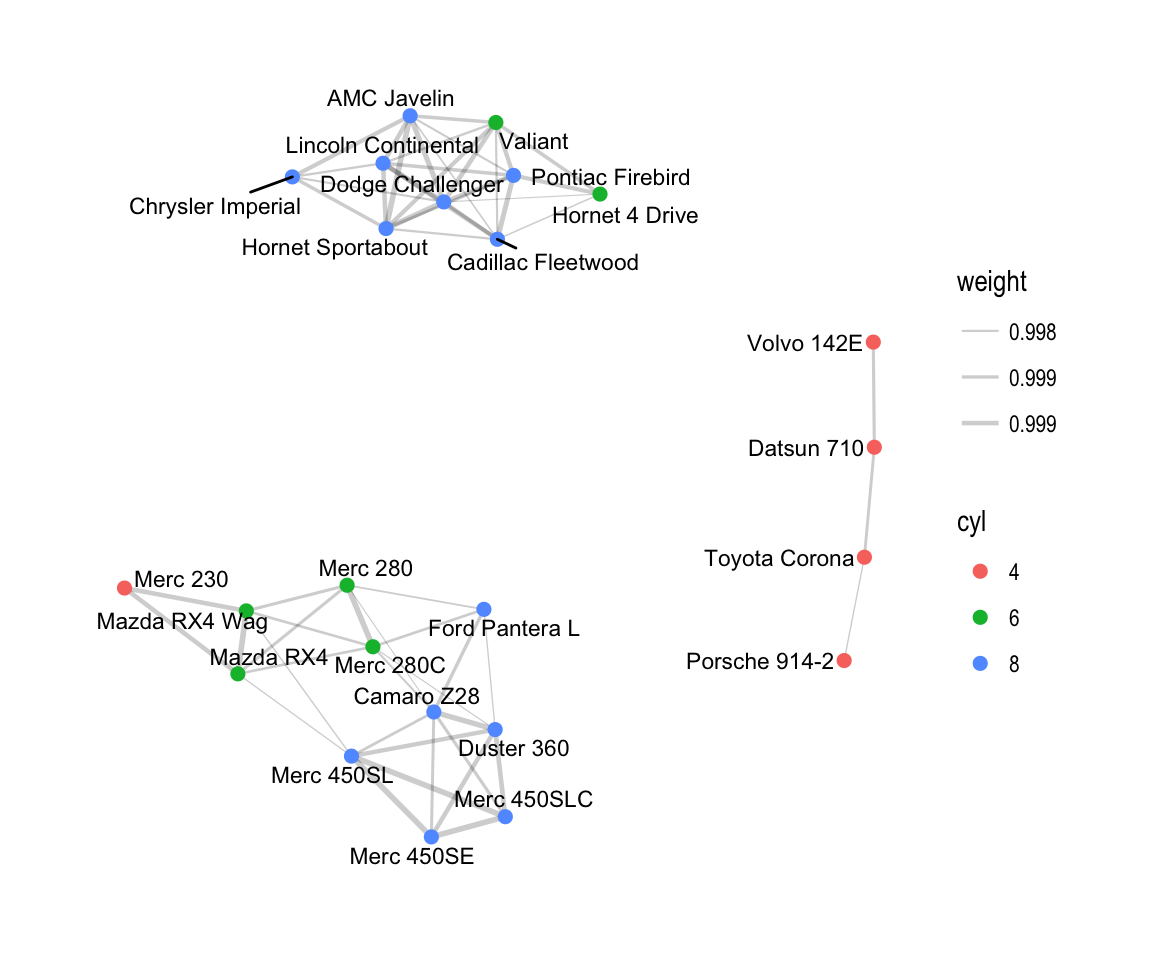
Network analysis
In this sections, we described methods for detecting important or central entities in a network graph. We’ll also introduce how to detect community (or cluster) in a network.
Centrality
Centrality is an important concept when analyzing network graph. The centrality of a node / edge measures how central (or important) is a node or edge in the network.
We consider an entity important, if he has connections to many other entities. Centrality describes the number of edges that are connected to nodes.
There many types of scores that determine centrality. One of the famous ones is the pagerank algorithm that was powering Google Search in the beginning.
Examples of common approaches of measuring centrality include:
betweenness centrality. The betweenness centrality for each nodes is the number of the shortest paths that pass through the nodes.
closeness centrality. Closeness centrality measures how many steps is required to access every other nodes from a given nodes. It describes the distance of a node to all other nodes. The more central a node is, the closer it is to all other nodes.
eigenvector centrality. A node is important if it is linked to by other important nodes. The centrality of each node is proportional to the sum of the centralities of those nodes to which it is connected. In general, nodes with high eigenvector centralities are those which are linked to many other nodes which are, in turn, connected to many others (and so on).
Hub and authority centarlities are generalization of eigenvector centrality. A high hub node points to many good authorities and a high authority node receives from many good hubs.
The tidygraph package contains more than 10 centrality measures, prefixed with the term centrality_. These measures include:
centrality_authority()
centrality_betweenness()
centrality_closeness()
centrality_hub()
centrality_pagerank()
centrality_eigen()
centrality_edge_betweenness()
All of these centrality functions returns a numeric vector matching the nodes (or edges in the case of `centrality_edge_betweenness()).
In the following examples, we’ll use the phone call network graph. We’ll change the color and the size of nodes according to their values of centrality.
set.seed(123)
phone.net %>%
  activate(nodes) %>%
  mutate(centrality = centrality_authority()) %>%
  ggraph(layout = "graphopt") +
  geom_edge_link(width = 1, colour = "lightgray") +
  geom_node_point(aes(size = centrality, colour = centrality)) +
  geom_node_text(aes(label = label), repel = TRUE)+
  scale_color_gradient(low = "yellow", high = "red")+
  theme_graph()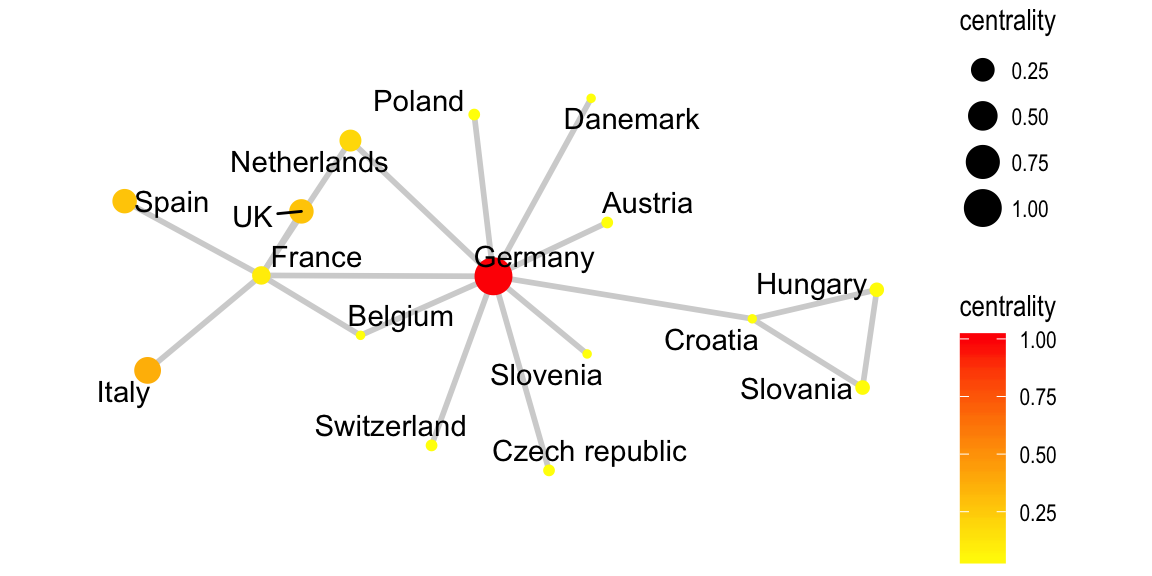
For a given problem at hand, you can test the different centrality score to decide which centrality measure makes most sense for your specific question.
Clustering
Clustering is a common operation in network analysis and it consists of grouping nodes based on the graph topology.
It’s sometimes referred to as community detection based on its commonality in social network analysis.
Many clustering algorithms from are available in the tidygraph package and prefixed with the term group_. These include:
- Infomap community finding. It groups nodes by minimizing the expected description length of a random walker trajectory. R function:
group_infomap() - Community structure detection based on edge betweenness. It groups densely connected nodes. R function:
group_edge_betweenness().
In the following example, we’ll use the correlation network graphs to detect clusters or communities:
set.seed(123)
cor.graph %>%
  activate(nodes) %>%
   mutate(community = as.factor(group_infomap())) %>%
  ggraph(layout = "graphopt") +
  geom_edge_link(width = 1, colour = "lightgray") +
  geom_node_point(aes(colour = community), size = 4) +
  geom_node_text(aes(label = label), repel = TRUE)+
  theme_graph()
Three communities are detected.
Read more
- Thomas Lin Pedersen. Introducing tidygraph. https://www.data-imaginist.com/2017/introducing-tidygraph/
- Shirin Glander. Network analysis of Game of Thrones. https://datascienceplus.com/network-analysis-of-game-of-thrones/