


Create and Customize Multi-panel ggplots: Easy Guide to Facet
This article describes how to split up your data by one or more variables and to visualize the subsets of the data together. The function facet() [in ggpubr] allows to draw multi-panel plots of a data set grouped by one or two variables. Additionally, we’ll show how to easily modify panel labels.
Contents:
Prerequisites
Required R packages: ggpubr to easily create ggplot2-based publication ready plots.
Install from CRAN:
install.packages("ggpubr")Or, install the latest developmental version from GitHub as follow:
if(!require(devtools)) install.packages("devtools")
devtools::install_github("kassambara/ggpubr")
Load ggpubr:
library(ggpubr)Basic plots
Demo data set:
df <- ToothGrowth
df$dose <- as.factor(df$dose)
head(df)
## len supp dose
## 1 4.2 VC 0.5
## 2 11.5 VC 0.5
## 3 7.3 VC 0.5
## 4 5.8 VC 0.5
## 5 6.4 VC 0.5
## 6 10.0 VC 0.5Plot:
p <- ggdensity(df, x = "len", fill = "dose",
               palette = "jco",
               ggtheme = theme_light(), legend = "top")
p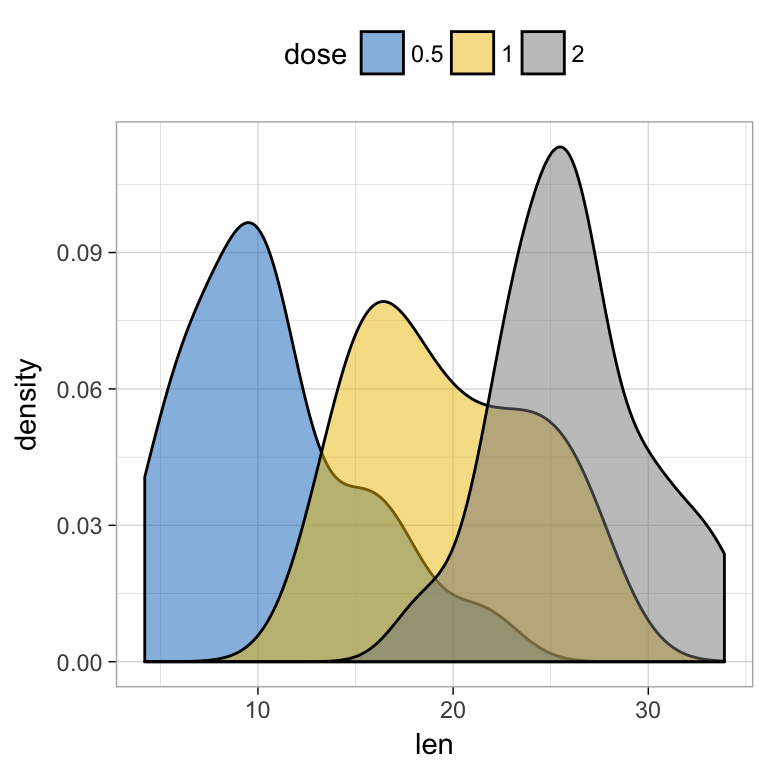
Facet by one grouping variables
Divide by the levels of the supp variable in the horizontal direction:
facet(p, facet.by = "supp")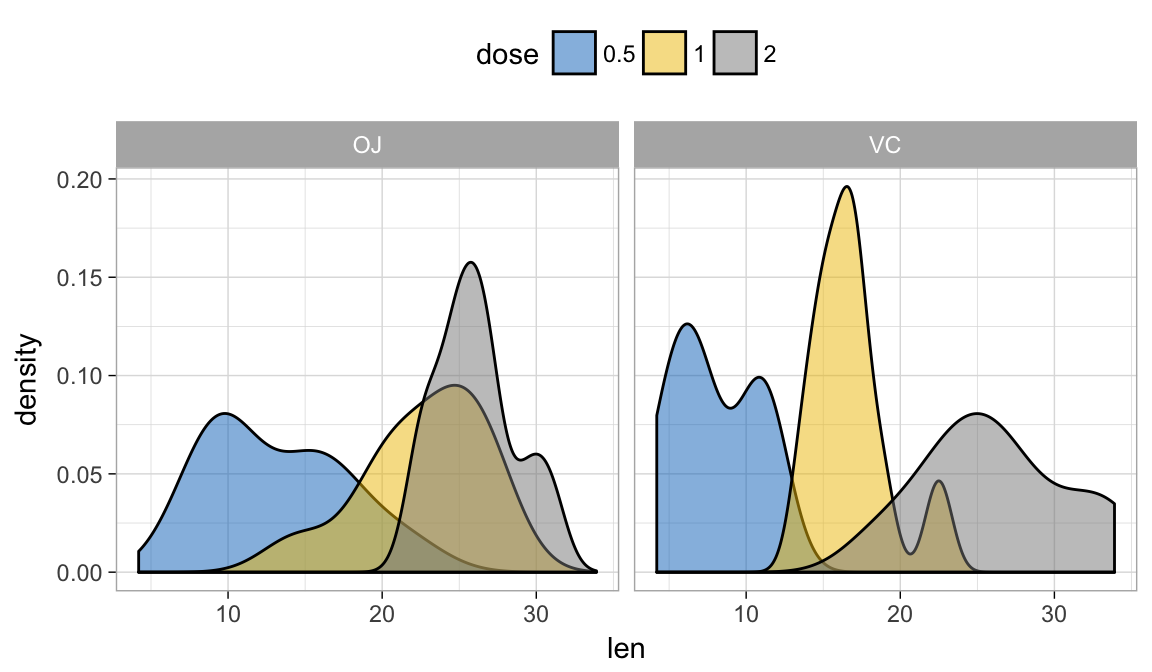
Divide by the levels of supp in the vertical direction –> use ncol = 1:
facet(p, facet.by = "supp", ncol = 1)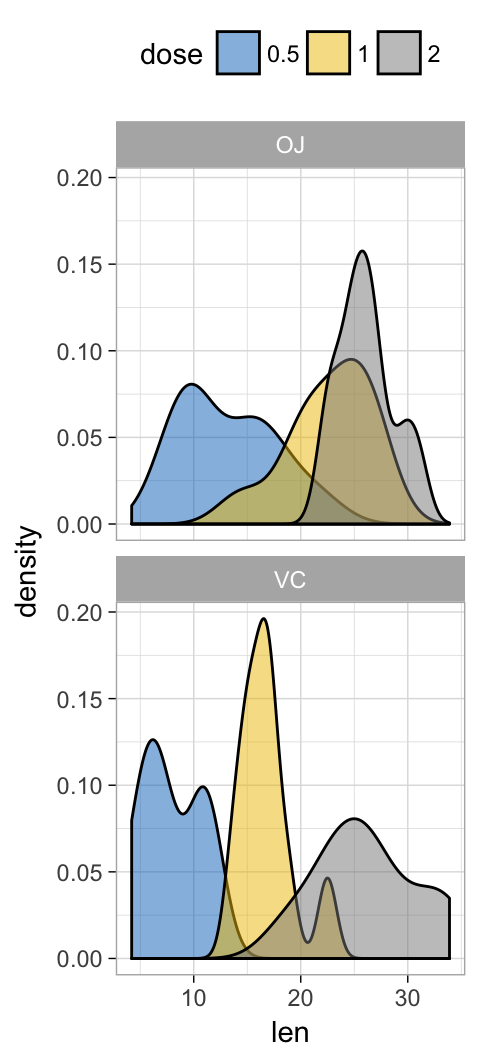
Facet by two grouping variables
The data can be split up by one or two variables that vary on the horizontal and/or vertical direction.
For example in facet.by = c(“supp”, “dose”):
- “supp”, the first variable, will be displayed in vertical direction
- “dose”, the second variable, will be displayed in horizontal direction.
# Divide with "supp" vertical, "dose" horizontal
facet(p, facet.by = c("supp", "dose"),
      short.panel.labs = FALSE)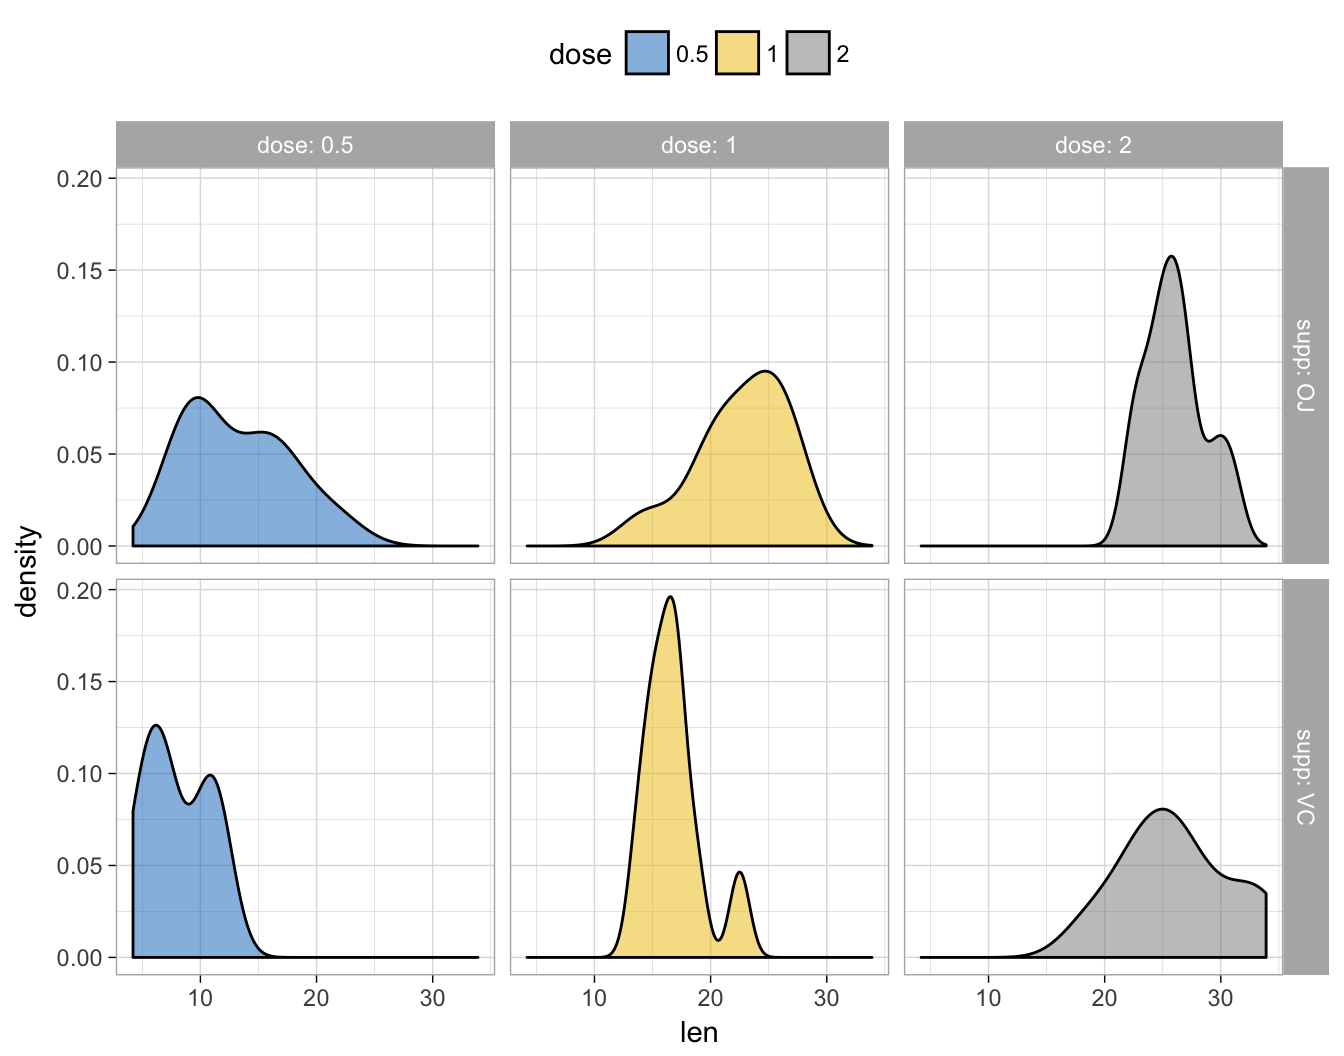
Modifying panel label appearance
Additional arguments are available to customize the appearance of panel labels (see ?facet). These include:
-
short.panel.labs: logical value. If TRUE, create short labels for panels by omitting variable names; in other words panels will be labelled only by variable grouping levels.
-
panel.labs: a list of one or two character vectors to modify facet label text. For example, panel.labs = list(sex = c(“Male”, “Female”)) specifies the labels for the “sex” variable. For two grouping variables, you can use for example panel.labs = list(sex = c(“Male”, “Female”), rx = c(“Obs”, “Lev”, “Lev2”) ).
-
panel.labs.background: a list of aesthetics to customize the background of panel labels. Should contain the combination of the following elements:
- color, linetype, size: background line color, type and size
- fill: background fill color. For example, panel.labs.background = list(color = “blue”, fill = “pink”).
-
panel.labs.font: a list of aesthetics indicating the size (e.g.: 14), the face/style (e.g.: “plain”, “bold”, “italic”, “bold.italic”) and the color (e.g.: “red”) and the orientation angle (e.g.: 45) of panel labels. Use panel.labs.font.x and panel.labs.font.y to customize only labels in x direction and y direction, respectively.
# Divide with "supp" vertical, "dose" horizontal
facet(p, facet.by = c("supp", "dose"),
       panel.labs = list(
         supp = c("Orange Juice", "Vitamin C"),
         dose = c("D0.5", "D1", "D2")
         ),
       panel.labs.background = list(color = "steelblue", fill = "steelblue", size = 0.5),
       panel.labs.font = list(color = "white"),
       panel.labs.font.x = list(angle = 45, color = "white")
      )