


Combine Multiple GGPlots in One Graph
This chapter describes, step by step, how to combine multiple ggplots in one graph, as well as, over multiple pages, using helper functions available in the ggpubr R package. We’ll also describe how to save the arranged plots and how to save multiple ggplots in one pdf file.
Contents:

Prerequisites
Load required packages and set the theme function theme_pubr() [in ggpubr] as the default theme:
library(ggplot2)
library(ggpubr)
theme_set(theme_pubr())
Arrange on one page
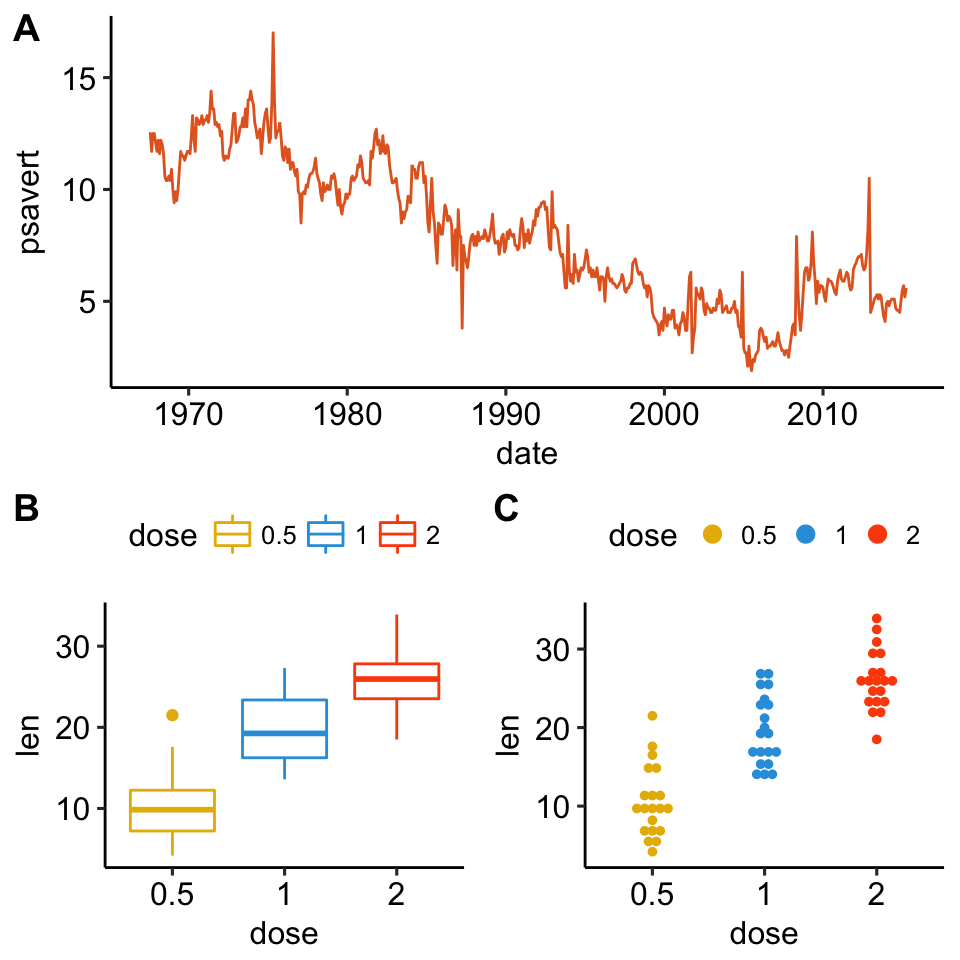
- Create some basic plots as follow:
# 0. Define custom color palette and prepare the data
my3cols <- c("#E7B800", "#2E9FDF", "#FC4E07")
ToothGrowth$dose <- as.factor(ToothGrowth$dose)
# 1. Create a box plot (bp)
p <- ggplot(ToothGrowth, aes(x = dose, y = len))
bxp <- p + geom_boxplot(aes(color = dose)) +
  scale_color_manual(values = my3cols)
# 2. Create a dot plot (dp)
dp <- p + geom_dotplot(aes(color = dose, fill = dose),
                       binaxis='y', stackdir='center') +
  scale_color_manual(values = my3cols) +
  scale_fill_manual(values = my3cols)
# 3. Create a line plot
lp <- ggplot(economics, aes(x = date, y = psavert)) +
geom_line(color = "#E46726") - Combine multiple ggplot on one page. Use the function
ggarrange()[ggpubr package], a wrapper around the functionplot_grid()[cowplot package]. Compared to plot_grid(), ggarange() can arrange multiple ggplots over multiple pages.
figure <- ggarrange(bxp, dp, lp,
                    labels = c("A", "B", "C"),
                    ncol = 2, nrow = 2)
figure
Annotate the arranged figure
Key R function: annotate_figure() [in ggpubr].
annotate_figure(
  figure,
  top = text_grob("Visualizing len",
                  color = "red", face = "bold", size = 14),
  bottom = text_grob("Data source: \n ToothGrowth", color = "blue",
                     hjust = 1, x = 1, face = "italic", size = 10),
  left = text_grob("Fig arranged using ggpubr",
                   color = "green", rot = 90),
  right = "I'm done, thanks :-)!",
  fig.lab = "Figure 1", fig.lab.face = "bold"
  )
Change column and row span of a plot
We’ll use nested ggarrange() functions to change column/row span of plots. For example, using the R code below:
- the line plot (lp) will live in the first row and spans over two columns
- the box plot (bxp) and the dot plot (dp) will be first arranged and will live in the second row with two different columns
ggarrange(
  lp,                # First row with line plot
  # Second row with box and dot plots
  ggarrange(bxp, dp, ncol = 2, labels = c("B", "C")),
  nrow = 2,
  labels = "A"       # Label of the line plot
) 
Use shared legend for combined ggplots
To place a common unique legend in the margin of the arranged plots, the function ggarrange() [in ggpubr] can be used with the following arguments:
common.legend = TRUE: place a common legend in a marginlegend: specify the legend position. Allowed values include one of c(“top”, “bottom”, “left”, “right”)
ggarrange(
  bxp, dp, labels = c("A", "B"),
  common.legend = TRUE, legend = "bottom"
  )
Mix table, text and ggplot2 graphs
In this section, we’ll show how to plot a table and text alongside a chart. The iris data set will be used.
We start by creating the following plots:
- a density plot of the variable “Sepal.Length”. R function: ggdensity() [in ggpubr]
- a plot of the summary table containing the descriptive statistics (mean, sd, … ) of Sepal.Length.
- R function for computing descriptive statistics: desc_statby() [in ggpubr].
- R function to draw a textual table: ggtexttable() [in ggpubr].
- a plot of a text paragraph. R function: ggparagraph() [in ggpubr].
We finish by arranging/combining the three plots using the function ggarrange() [in ggpubr]
# Density plot of "Sepal.Length"
#::::::::::::::::::::::::::::::::::::::
density.p <- ggdensity(iris, x = "Sepal.Length",
                       fill = "Species", palette = "jco")
# Draw the summary table of Sepal.Length
#::::::::::::::::::::::::::::::::::::::
# Compute descriptive statistics by groups
stable <- desc_statby(iris, measure.var = "Sepal.Length",
                      grps = "Species")
stable <- stable[, c("Species", "length", "mean", "sd")]
# Summary table plot, medium orange theme
stable.p <- ggtexttable(stable, rows = NULL,
                        theme = ttheme("mOrange"))
# Draw text
#::::::::::::::::::::::::::::::::::::::
text <- paste("iris data set gives the measurements in cm",
              "of the variables sepal length and width",
              "and petal length and width, respectively,",
              "for 50 flowers from each of 3 species of iris.",
             "The species are Iris setosa, versicolor, and virginica.",
             sep = " ")
text.p <- ggparagraph(text = text, face = "italic", size = 11, color = "black")
# Arrange the plots on the same page
ggarrange(density.p, stable.p, text.p,
          ncol = 1, nrow = 3,
          heights = c(1, 0.5, 0.3))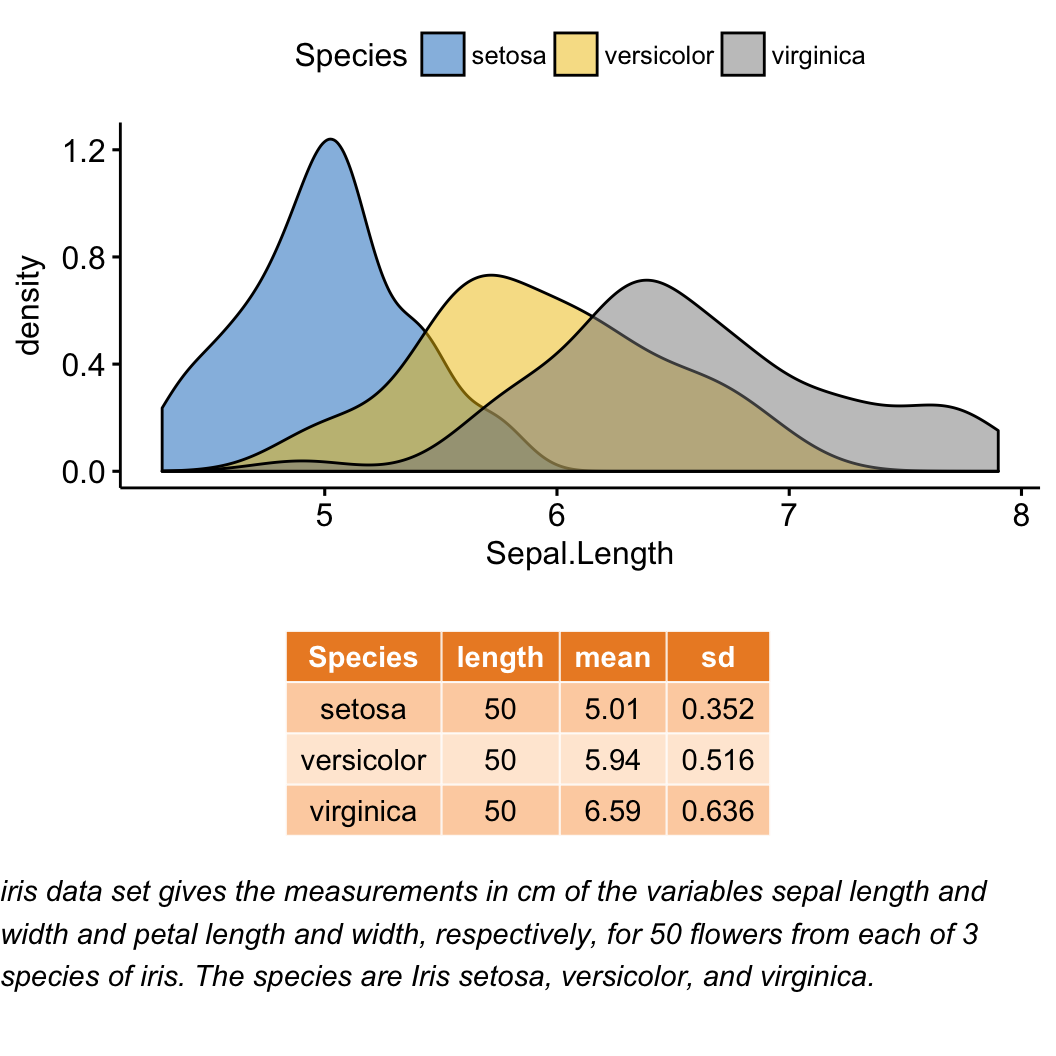
Arrange over multiple pages
If you have a long list of ggplots, say n = 20 plots, you may want to arrange the plots and to place them on multiple pages. With 4 plots per page, you need 5 pages to hold the 20 plots.
The function ggarrange() [ggpubr] provides a convenient solution to arrange multiple ggplots over multiple pages. After specifying the arguments nrow and ncol,ggarrange()` computes automatically the number of pages required to hold the list of the plots. It returns a list of arranged ggplots.
For example the following R code,
multi.page <- ggarrange(bxp, dp, lp, bxp,
                        nrow = 1, ncol = 2)
returns a list of two pages with two plots per page. You can visualize each page as follow:
multi.page[[1]] # Visualize page 1
multi.page[[2]] # Visualize page 2
You can also export the arranged plots to a pdf file using the function ggexport() [ggpubr]:
ggexport(multi.page, filename = "multi.page.ggplot2.pdf")See the PDF file: Multi.page.ggplot2
Export the arranged plots
R function: ggexport() [in ggpubr].
- Export the arranged figure to a pdf, eps or png file (one figure per page).
ggexport(figure, filename = "figure1.pdf")- It’s also possible to arrange the plots (2 plot per page) when exporting them.
Export individual plots to a pdf file (one plot per page):
ggexport(bxp, dp, lp, bxp, filename = "test.pdf")Arrange and export. Specify the nrow and ncol arguments to display multiple plots on the same page:
ggexport(bxp, dp, lp, bxp, filename = "test.pdf",
         nrow = 2, ncol = 1)
See also
- ggplot2 - Easy Way to Mix Multiple Graphs on The Same Page. https://goo.gl/WrieY4