r2excel: Read, write and format easily Excel files using R software
Many solutions to read and write Excel files using R software

Excel files are used by many people to save and analyze their data. There are many R packages and solutions to import data from Excel to R and to export data from R to Excel:
- ODBC connection: For Windows only and it requires the Excel ODBC driver
- gdata package: it is available for Windows, Mac and Linux but it requires the installation of additional perl libraries.
- xlsReadWrite package : For Windows only and there is no longer an updated version of xlsReadWrite package.
- RExcel software : This is a powerful tool that can be used to execute directly R code from an Excel spreadsheet but it is available for windows only.
- XLConnect package : XLConnect is a java-based solution, so it is available for Windows, Mac and Linux. It may be slow for large data sets
- xlsx package: This is my favorite package to read, write and format Excel files in R. It is a java-based solution and can be used to read and write both xls and xlsx file formats.
As listed above, there are many ways to connect R and Excel, but many of these packages are :
- hard to work with
- or only work in Windows
- or require additional drivers
- or only work with old versions of Excel (.xls but not .xlsx)
The 3 R packages you should know to save your time
The three R packages you should know for importing and exporting data from/to Excel are xlsx, XLConnect and r2excel packages.
Reading and writing Excel files are know an easy task using xlsx and XLConnect packages. Formatting Excel files using xlsx package is also possible. However, it requires a hard coding in R. This is why, I implemented r2excel package which depends on xlsx package and it provides an easy to use functions to quickly import data from excel and to create a nice Excel report.
r2excel package
Install and load r2excel package
To install the package, use the following R code :
install.packages("devtools")
devtools::install_github("kassambara/r2excel")
Load the package using the following R code:
library(r2excel)Available R functions
The list of functions available in r2excel package are :
- xlsx.addHeader for adding headers.
- xlsx.addPlot for adding plots.
- xlsx.addParagraph for adding a paragraph of text.
- xlsx.addTable for adding a data frame.
- xlsx.addLineBreak for adding a line break. This is useful to skip lines between two data frames.
- xlsx.addHyperlink for adding a hyperlink.
- xlsx.readFile for reading an Excel file.
- xlsx.writeFile for writing a data to an Excel file.
- xlsx.writeMultipleData for exporting quickly multiple data to the same Excel workbook
- xlsx.openFile for opening an Excel file.
These functions are described in the next sections
Create your first Excel file
library("r2excel")
# Create an Excel workbook.
# Both .xls and .xlsx file formats can be used.
filename <- "r2excel-example1.xlsx"
wb <- createWorkbook(type="xlsx")
# Create a sheet in that workbook to contain the data table
sheet <- createSheet(wb, sheetName = "example1")

# Add header
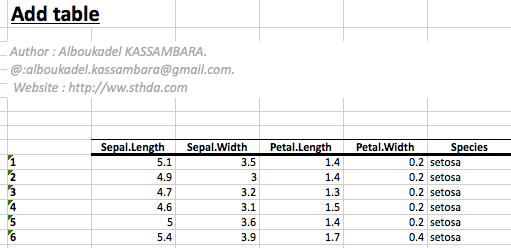
xlsx.addHeader(wb, sheet, value="Add table",level=1,
               color="black", underline=1)
xlsx.addLineBreak(sheet, 1)

# Add paragraph : Author
author=paste("Author : Alboukadel KASSAMBARA. \n",
             "@:alboukadel.kassambara@gmail.com.",
             "\n Website : http://ww.sthda.com", sep="")
xlsx.addParagraph(wb, sheet,value=author, isItalic=TRUE, colSpan=5,
                  rowSpan=4, fontColor="darkgray", fontSize=14)
xlsx.addLineBreak(sheet, 3)

# Add table : add a data frame
xlsx.addTable(wb, sheet, head(iris), startCol=2)
xlsx.addLineBreak(sheet, 2)

# save the workbook to an Excel file
saveWorkbook(wb, filename)
xlsx.openFile(filename)# View the file
The image of the excel file created by the above code is :
Add headers
To add a header to a worksheet the xlsx.addHeader() function can be used. A simplified format is :
xlsx.addHeader(wb, sheet, value="Header", level=1,
color="#FFFFFF", underline=c(0,1,2))- wb : workbook object
- sheet : sheet object
- value : the text to write as a header
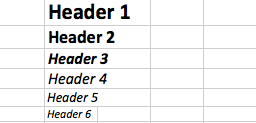
- level : header level; possible values are form 1 to 6
- color : the color to use for the header
- underline : a numeric value specifying whether the header should be underlined or not. Possible values are 0 (default value, no underline), 1 (underline with one line), 2 (underline with two lines)
Examples :
# create workbook and sheet
wb <- createWorkbook(type="xlsx")
sheet <- xlsx::createSheet(wb, sheetName = "example1")
#Header
#**************************************
# header level 1
xlsx.addHeader(wb, sheet, value="Header 1",level=1, color="black")
# header level 2
xlsx.addHeader(wb, sheet, value="Header 2",level=2, color="black")
# header level 3
xlsx.addHeader(wb, sheet, value="Header 3",level=3, color="black")
# header level 4
xlsx.addHeader(wb, sheet, value="Header 4",level=4, color="black")
# header level 5
xlsx.addHeader(wb, sheet, value="Header 5",level=5, color="black")
# header level 6
xlsx.addHeader(wb, sheet, value="Header 6",level=6, color="black")

# saving a workbook to an Excel file
saveWorkbook(wb, "examples_add_header.xlsx")
xlsx.openFile("examples_add_header.xlsx")# view the file
The image of the excel file created by the above code is :
Add a paragraph of texts
The function xlsx.addParagraph() can be used. A simplified format is :
xlsx.addParagraph(wb, sheet, value, fontColor="#FFFFFF",
    fontSize=12, isBold=FALSE, isItalic=FALSE,
colSpan=10, rowSpan=5)- wb : workbook object
- sheet : sheet object
- value : the text to write
- fontColor : color of the text
- fontSize : size of the text
- isBold : if TRUE, the text is written in bold format
- isItalic : if TRUE, the text is written in italic format
- colSpan : number of columns to be merged (paragraph : width)
- rowSpan : number of rows to be merged (paragraph height)
Examples :
# create workbook and sheet
wb <- createWorkbook(type="xlsx")
sheet <- createSheet(wb, sheetName = "example1")

# Add paragraph
xlsx.addHeader(wb, sheet, " Add paragraph", level=2, underline=1)
xlsx.addLineBreak(sheet, 2)
paragraph="Lorem Ipsum is simply dummy text of the printing and typesetting industry. Lorem Ipsum has been the industry's standard dummy text ever since the 1500s, when an unknown printer took a galley of type and scrambled it to make a type specimen book. It has survived not only five centuries, but also the leap into electronic typesetting, remaining essentially unchanged."
xlsx.addParagraph(wb, sheet, paragraph, fontSize=14, isItalic=TRUE,
                  fontColor="darkred", colSpan=10, rowSpan=10)
# save the workbook to an Excel file
saveWorkbook(wb, "examples_add_paragraph.xlsx")
xlsx.openFile("examples_add_paragraph.xlsx")# view the file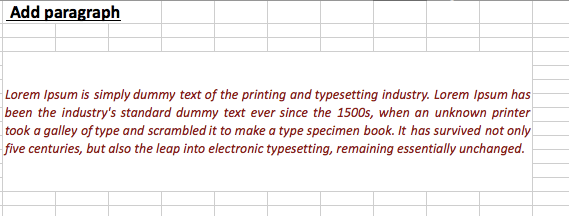
Add a hyperlink
The function xlsx.addHyperlink() can be used. A simplified format is:
xlsx.addHyperlink(wb,sheet, address, friendlyName) - wb : workbook object
- sheet : sheet object
- address : text indicating the url
- friendlyName : text specifying the name of the link
Examples :
# create workbook and sheet
wb <- createWorkbook(type="xlsx")
sheet <- createSheet(wb, sheetName = "example1")

# Add Hyperlink
#+++++++++++++++++++++++++++++
xlsx.addHeader(wb, sheet, " Add Hyperlink", level=2, underline=1)
xlsx.addLineBreak(sheet, 1)
xlsx.addHyperlink(wb, sheet, "https://www.sthda.com", "Click-me!", fontSize=12)
xlsx.addLineBreak(sheet, 2)
# save the workbook to an Excel file
saveWorkbook(wb, "examples_add_hyperlink.xlsx")
xlsx.openFile("examples_add_hyperlink.xlsx")# view the file
Add a data frame
The function xlsx.addTable can be used. A simplified format is :
xlsx.addTable(wb, sheet, data, col.names=TRUE, row.names=TRUE,
fontColor="#FFFFFF", fontSize=12, rowFill=c("white", "white"))- wb : workbook object
- sheet : sheet object
- data : a data frame
- col.names, row.names : a logical value indicating whether the column names / row names of the data are to be written to the file. Default is TRUE
- font.color : the color of the text
- font.size : the size of text
- rowFill : a vector of two colors for filling odd and even rows. Default is c(“white”, “white”)
# create workbook and sheet
wb <- createWorkbook(type="xlsx")
sheet <- createSheet(wb, sheetName = "example1")
# add iris data using default settings
data(iris)
xlsx.addHeader(wb, sheet,
     value="Add iris table using default settings")
xlsx.addLineBreak(sheet, 1)
xlsx.addTable(wb, sheet, head(iris))
xlsx.addLineBreak(sheet, 2)

# Customized table
xlsx.addHeader(wb, sheet, value="Customized table")
xlsx.addLineBreak(sheet, 1)
xlsx.addTable(wb, sheet, data= head(iris),
              fontColor="darkblue", fontSize=14,
              rowFill=c("white", "lightblue")
)
xlsx.addLineBreak(sheet, 2)
# save the workbook to an Excel file
saveWorkbook(wb, "examples_add_table.xlsx")
xlsx.openFile("examples_add_table.xlsx")# view the file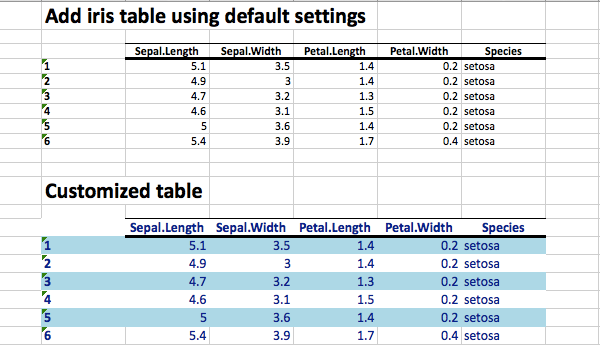
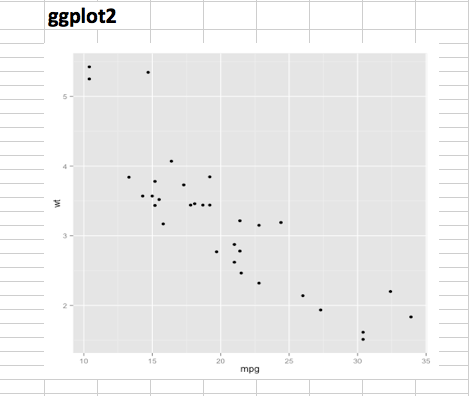
Add a plot
The function xlsx.addPlot() can be used. A simplified format is :
xlsx.addPlot(wb, sheet, plotFunction,
width = 480, height = 480, ...)- wb : workbook object
- sheet : sheet object
- plotFunction : an R function creating a plot.
- width, height : the width and the height of the plot
- … : others arguments to png() function
Examples :
# creat workbook and sheet
wb <- createWorkbook(type="xlsx")
sheet <- createSheet(wb, sheetName = "example1")

# basic box plot
data(ToothGrowth)
xlsx.addHeader(wb, sheet, "Basic box plot")
xlsx.addLineBreak(sheet, 1)
plotFunction<-function(){boxplot(len ~ dose, data = ToothGrowth, col = 1:3)}
xlsx.addPlot(wb, sheet, plotFunction())
# ggplot2
library("ggplot2")
xlsx.addHeader(wb, sheet, "ggplot2")
xlsx.addLineBreak(sheet, 1)
plotFunction<-function(){
  p<-qplot(mpg, wt, data=mtcars)
  print(p)
  }
xlsx.addPlot(wb, sheet, plotFunction())
# save the workbook to an Excel file.
saveWorkbook(wb, "examples_add_plot.xlsx")
xlsx.openFile("examples_add_plot.xlsx")# view the file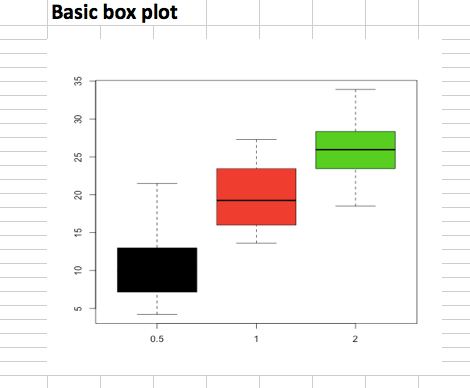
Read an Excel file
The function xlsx.readFile() can be used. A simplified format is :
xlsx.readFile(file, sheetIndex = 1, header = TRUE)- file : the path to the file to read
- sheetIndex : a number indicating the index of the sheet to read from the workbook
- header : a logical value. If TRUE, the first row is used as the names of the variables
Examples :
file <- system.file("tests", "test_import.xlsx", package = "xlsx")
res <- xlsx.readFile(file, 1)  # read first sheet
head(res)
Population Income Illiteracy Life.Exp Murder HS.Grad Frost Area
1 3615 3624 2.1 69.05 15.1 41.3 20 50708
2 365 6315 1.5 69.31 11.3 66.7 152 566432
3 2212 4530 1.8 70.55 7.8 58.1 15 113417
4 2110 3378 1.9 70.66 10.1 39.9 65 51945
5 21198 5114 1.1 71.71 10.3 62.6 20 156361
6 2541 4884 0.7 72.06 6.8 63.9 166 103766Write an Excel file
The function xlsx.writeFile can be used. A simplified format is :
xlsx.writeFile(data, file, sheetName = "Sheet1",
col.names = TRUE, row.names = TRUE, append = FALSE)- data : a data.frame to write to the workbook
- file : the path to the output file
- sheetName : a character string to use for the sheet name.
- col.names, row.names : a logical value specifying whether the column names/row names of the data are to be written to the file
- append : a logical value indicating if the data should be appended to an existing file.
Examples :
xlsx.writeFile(USArrests, file="myworkbook.xlsx",
               sheetName="USA Arrests")
xlsx.openFile("myworkbook.xlsx")# view the file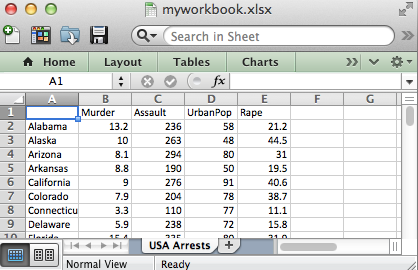
Use the argument append = TRUE to add multiple data.frame in the same Excel workbook :
# Write the first data set in a new workbook
xlsx.writeFile(USArrests, file="myworkbook.xlsx",
            sheetName="USA-ARRESTS", append=FALSE)
# Add a second data set
xlsx.writeFile(mtcars, file="myworkbook.xlsx",
          sheetName="MTCARS", append=TRUE)
# Add a third data set
xlsx.writeFile(Titanic, file="myworkbook.xlsx",
          sheetName="TITANIC", append=TRUE)
xlsx.openFile("myworkbook.xlsx")# view the file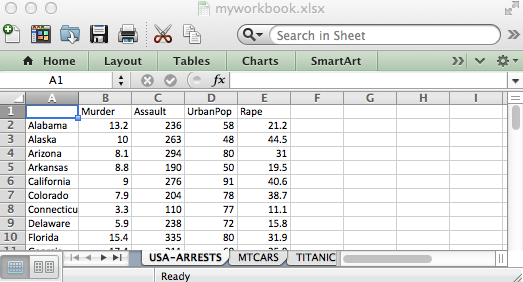
The method above is very repetitive. You can use the function xlsx.writeMultipleData() to add multiple data sets to the same workbook in a single call.
xlsx.writeMultipleData("myworkbook.xlsx",
          mtcars, Titanic, AirPassengers, state.x77)
xlsx.openFile("myworkbook.xlsx")# view the file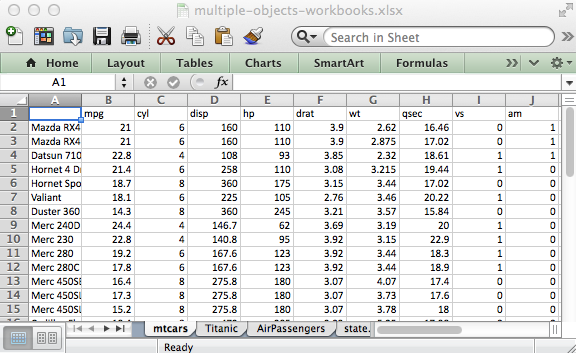
The function xlsx.writeMultipleData works for data frames (mtcars), matrices (state.x77), time series (AirPassengers) and tables (Titanic).
A full and nice report using R and Excel
The following R code can be used to create a full Excel report :
# Create an Excel workbook.
# Both .xls and .xlsx file formats can be used.
filename<-"r2excel-example.xlsx"
wb <- createWorkbook(type="xlsx")
# Create a sheet in that workbook
sheet <- xlsx::createSheet(wb, sheetName = "example1")
# Add header
#+++++++++++++++++++++++++++++++
# Create the Sheet title and subtitle
xlsx.addHeader(wb, sheet, value="Excel file written with r2excel packages",
            level=1, color="darkblue", underline=2)
xlsx.addLineBreak(sheet, 2)
# Add paragraph : Author
author=paste("Author : Alboukadel KASSAMBARA. \n",
             "@:alboukadel.kassambara@gmail.com.",
             "\n Website : http://ww.sthda.com", sep="")
xlsx.addParagraph(wb, sheet,value=author, isItalic=TRUE, colSpan=5,
                  rowSpan=4, fontColor="darkgray", fontSize=14)
xlsx.addLineBreak(sheet, 3)
# Add table
#+++++++++++++++++++++++++++++
# add iris data using default settings
data(iris)
xlsx.addHeader(wb, sheet, value="Add iris table using default settings", level=2)
xlsx.addLineBreak(sheet, 1)
xlsx.addTable(wb, sheet, head(iris), startCol=2)
xlsx.addLineBreak(sheet, 2)

# Customized table
xlsx.addHeader(wb, sheet, value="Customized table", level=2)
xlsx.addLineBreak(sheet, 1)
xlsx.addTable(wb, sheet, data= head(iris),
              fontColor="darkblue", fontSize=14,
              rowFill=c("white", "lightblue")
)
xlsx.addLineBreak(sheet, 2)
# Add paragraph
#+++++++++++++++++++++++++++++
xlsx.addHeader(wb, sheet, "Add paragraph", level=2)
xlsx.addLineBreak(sheet, 2)
paragraph="Lorem Ipsum is simply dummy text of the printing and typesetting industry. Lorem Ipsum has been the industry's standard dummy text ever since the 1500s, when an unknown printer took a galley of type and scrambled it to make a type specimen book. It has survived not only five centuries, but also the leap into electronic typesetting, remaining essentially unchanged."
xlsx.addParagraph(wb, sheet, paragraph, fontSize=14, isItalic=TRUE,
                  fontColor="darkred", backGroundColor="gray")
xlsx.addLineBreak(sheet, 2)
# Add Hyperlink
#+++++++++++++++++++++++++++++
xlsx.addHeader(wb, sheet, " Add Hyperlink", level=2)
xlsx.addLineBreak(sheet, 1)
xlsx.addHyperlink(wb, sheet, "https://www.sthda.com", "Click-me!!", fontSize=12)
xlsx.addLineBreak(sheet, 2)
# Add box plot
#+++++++++++++++++++++++++++++
data(ToothGrowth)
xlsx.addHeader(wb, sheet, " Add Plot", level=2)
xlsx.addLineBreak(sheet, 1)
plotFunction<-function(){boxplot(len ~ dose, data = ToothGrowth, col = 1:3)}
xlsx.addPlot(wb, sheet, plotFunction())
# save the workbook to an Excel file and write the file to disk.
xlsx::saveWorkbook(wb, filename)
xlsx.openFile(filename) # open file
Infos
This analysis has been performed using R (ver. 3.1.0).
Show me some love with the like buttons below... Thank you and please don't forget to share and comment below!!
Montrez-moi un peu d'amour avec les like ci-dessous ... Merci et n'oubliez pas, s'il vous plaît, de partager et de commenter ci-dessous!
Recommended for You!
Recommended for you
This section contains the best data science and self-development resources to help you on your path.
Books - Data Science
Our Books
- Practical Guide to Cluster Analysis in R by A. Kassambara (Datanovia)
- Practical Guide To Principal Component Methods in R by A. Kassambara (Datanovia)
- Machine Learning Essentials: Practical Guide in R by A. Kassambara (Datanovia)
- R Graphics Essentials for Great Data Visualization by A. Kassambara (Datanovia)
- GGPlot2 Essentials for Great Data Visualization in R by A. Kassambara (Datanovia)
- Network Analysis and Visualization in R by A. Kassambara (Datanovia)
- Practical Statistics in R for Comparing Groups: Numerical Variables by A. Kassambara (Datanovia)
- Inter-Rater Reliability Essentials: Practical Guide in R by A. Kassambara (Datanovia)
Others
- R for Data Science: Import, Tidy, Transform, Visualize, and Model Data by Hadley Wickham & Garrett Grolemund
- Hands-On Machine Learning with Scikit-Learn, Keras, and TensorFlow: Concepts, Tools, and Techniques to Build Intelligent Systems by Aurelien Géron
- Practical Statistics for Data Scientists: 50 Essential Concepts by Peter Bruce & Andrew Bruce
- Hands-On Programming with R: Write Your Own Functions And Simulations by Garrett Grolemund & Hadley Wickham
- An Introduction to Statistical Learning: with Applications in R by Gareth James et al.
- Deep Learning with R by François Chollet & J.J. Allaire
- Deep Learning with Python by François Chollet
Click to follow us on Facebook :
Comment this article by clicking on "Discussion" button (top-right position of this page)


