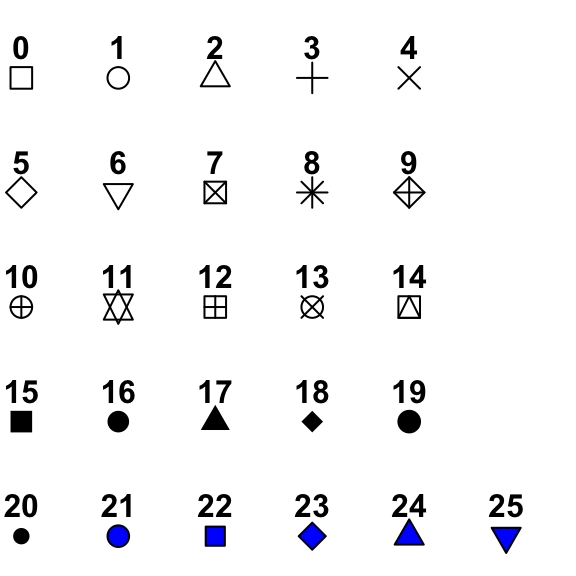
R plot pch symbols : The different point shapes available in R
Different plotting symbols are available in R. The graphical argument used to specify point shapes is pch.
Plotting symbols
The different points symbols commonly used in R are shown in the figure below :

The function used to generate this figure is provided at the end of this document
- pch = 0,square
- pch = 1,circle
- pch = 2,triangle point up
- pch = 3,plus
- pch = 4,cross
- pch = 5,diamond
- pch = 6,triangle point down
- pch = 7,square cross
- pch = 8,star
- pch = 9,diamond plus
- pch = 10,circle plus
- pch = 11,triangles up and down
- pch = 12,square plus
- pch = 13,circle cross
- pch = 14,square and triangle down
- pch = 15, filled square
- pch = 16, filled circle
- pch = 17, filled triangle point-up
- pch = 18, filled diamond
- pch = 19, solid circle
- pch = 20,bullet (smaller circle)
- pch = 21, filled circle blue
- pch = 22, filled square blue
- pch = 23, filled diamond blue
- pch = 24, filled triangle point-up blue
- pch = 25, filled triangle point down blue
Point can be omitted from the plot using pch = NA.
Examples
x<-c(2.2, 3, 3.8, 4.5, 7, 8.5, 6.7, 5.5)
y<-c(4, 5.5, 4.5, 9, 11, 15.2, 13.3, 10.5)
# Plot points
plot(x, y)
# Change plotting symbol
# Use solid circle
plot(x, y, pch = 19)

By default pch=1
The following arguments can be used to change the color and the size of the points :
- col : color (code or name) to use for the points
- bg : the background (or fill) color for the open plot symbols. It can be used only when pch = 21:25.
- cex : the size of pch symbols
- lwd : the line width for the plotting symbols
# Change color
plot(x, y, pch=19, col="darkgreen", cex=1.5)
# Color can be a vector
plot(x, y, pch=19, col=c("green", "red"))
# change border, background color and line width
plot(x, y, pch = 24, cex=2, col="blue", bg="red", lwd=2)


Note that, only pch from 21 to 25 can be filled using the argument bg=
Other characters can be used to specify pch including “+”, “*“,”-“,”.“,”#, “%”, “o”
set.seed(1234)
plot(x=rnorm(100), y=rnorm(100), pch="+")
R script to generate a plot of point shapes in R
Use the following R function to display a graph of the plotting symbols :
#++++++++++++++++++++++++++++++++++++++++++++
#generate a plot of point shapes which R knows about.
#++++++++++++++++++++++++++++++++++++++++++++
generateRPointShapes<-function(){
  oldPar<-par()
  par(font=2, mar=c(0.5,0,0,0))
  y=rev(c(rep(1,6),rep(2,5), rep(3,5), rep(4,5), rep(5,5)))
  x=c(rep(1:5,5),6)
  plot(x, y, pch = 0:25, cex=1.5, ylim=c(1,5.5), xlim=c(1,6.5),
       axes=FALSE, xlab="", ylab="", bg="blue")
  text(x, y, labels=0:25, pos=3)
  par(mar=oldPar$mar,font=oldPar$font )
}
generateRPointShapes()
Infos
This analysis has been performed using R (ver. 3.1.0).
Enjoyed this article? I’d be very grateful if you’d help it spread by emailing it to a friend, or sharing it on Twitter, Facebook or Linked In.
Show me some love with the like buttons below... Thank you and please don't forget to share and comment below!!
Show me some love with the like buttons below... Thank you and please don't forget to share and comment below!!
Avez vous aimé cet article? Je vous serais très reconnaissant si vous aidiez à sa diffusion en l'envoyant par courriel à un ami ou en le partageant sur Twitter, Facebook ou Linked In.
Montrez-moi un peu d'amour avec les like ci-dessous ... Merci et n'oubliez pas, s'il vous plaît, de partager et de commenter ci-dessous!
Montrez-moi un peu d'amour avec les like ci-dessous ... Merci et n'oubliez pas, s'il vous plaît, de partager et de commenter ci-dessous!
Recommended for You!
Recommended for you
This section contains the best data science and self-development resources to help you on your path.
Books - Data Science
Our Books
- Practical Guide to Cluster Analysis in R by A. Kassambara (Datanovia)
- Practical Guide To Principal Component Methods in R by A. Kassambara (Datanovia)
- Machine Learning Essentials: Practical Guide in R by A. Kassambara (Datanovia)
- R Graphics Essentials for Great Data Visualization by A. Kassambara (Datanovia)
- GGPlot2 Essentials for Great Data Visualization in R by A. Kassambara (Datanovia)
- Network Analysis and Visualization in R by A. Kassambara (Datanovia)
- Practical Statistics in R for Comparing Groups: Numerical Variables by A. Kassambara (Datanovia)
- Inter-Rater Reliability Essentials: Practical Guide in R by A. Kassambara (Datanovia)
Others
- R for Data Science: Import, Tidy, Transform, Visualize, and Model Data by Hadley Wickham & Garrett Grolemund
- Hands-On Machine Learning with Scikit-Learn, Keras, and TensorFlow: Concepts, Tools, and Techniques to Build Intelligent Systems by Aurelien Géron
- Practical Statistics for Data Scientists: 50 Essential Concepts by Peter Bruce & Andrew Bruce
- Hands-On Programming with R: Write Your Own Functions And Simulations by Garrett Grolemund & Hadley Wickham
- An Introduction to Statistical Learning: with Applications in R by Gareth James et al.
- Deep Learning with R by François Chollet & J.J. Allaire
- Deep Learning with Python by François Chollet
Get involved :
Click to follow us on Facebook :
Comment this article by clicking on "Discussion" button (top-right position of this page)
Click to follow us on Facebook :
Comment this article by clicking on "Discussion" button (top-right position of this page)


