easyGgplot2
What is ggplot2 ?
ggplot2 is a powerful R package, implemented by Hadley Wickham, for producing nice graphs. The gg in ggplot2 means Grammar of Graphics, a graphic concept which describes plots by using a “grammar”. Plot can be divided in different fundamental parts : Plot <- data + Aesthetics + Geometry.
data are a data.frame Aesthetics is used to specify x and y variables. It can also be used to control the color, the size or the shape of a point, the height of a bar, etc….. Geometry corresponds to the type of graphs (histogram, box plot, line plot, density plot, dot plot, ….)
Read more —-> ggplot2 online documentation
Introduction to easyGgplot2 package
“ggplot2 is too complicated: it is hard for me to improve, and hard for new developers to understand.” — Hadley Wickham 2011 (http://vita.had.co.nz/papers/future-ig.pdf)
The idea behind ggplot2 is seductively simple but the detail is, yes, difficult. To customize a plot, the syntax is sometimes a tiny bit opaque and this raises the level of difficulty.
For these reasons, I created the easyGgplot2 package (which depends on ggplot2) to make and customize quickly plots including box plot, dot plot, strip chart, violin plot, histogram, density plot, scatter plot, bar plot, line plot, etc, ….
In this chapter, you will find many tutorials on ggplot2 plotting systems and on how to personalize quickly graphical parameters including title, axis labels, legend, background and colors.
The syntax used to call easyGgplot2 functions is simple and it’s a kind of an easy interface between users and ggplot2 package. An example to illustrate the difference between the syntax of ggplot2 and easyGgplot2 is shown hereafter.
Install and load easyGgplot2 package
To install the package, use the following R code from an R console (R >=3.1.0) :
install.packages("devtools")
library(devtools)
install_github("easyGgplot2", "kassambara")
Load the package using the R code:
library(easyGgplot2)Syntax of easyGgplot2 and ggplot2 packages
In the following R code, a box plot is drawn using either ggplot2 or easyGgplot2.
ggplot2 syntax :
ggplot(data=ToothGrowth, aes(x=dose, y=len, fill=dose))+
    geom_boxplot()+
    # Customize main title, x and y axis labels
    ggtitle("Plot of length \n by dose") + xlab("Dose (mg)")+
    theme(
        # customize main title
         plot.title = element_text( size=14, face="bold.italic",
                              colour="red", lineheight=1.0),
          # customize x and y axis labels
          axis.title.x=element_text(size=14, face="bold",
                              colour="blue", hjust=0.4),
          axis.title.y=element_text(size=14, face="bold",
                              colour="blue", vjust=0.4, angle=90))+
          #change group colors
          scale_fill_manual(values=c('#999999','#E69F00','#56B4E9'))
easyGgplot2 syntax :
# Change main title and axis titles
# Customize title styles. Possible values for the font style :
  # 'plain', 'italic', 'bold', 'bold.italic'.
ggplot2.boxplot(data=ToothGrowth, xName='dose',yName='len',
              groupName="dose",
              groupColors=c('#999999','#E69F00','#56B4E9'),
              xtitle="Dose (mg)", ytitle="Length",
              mainTitle="Plot of length \n by dose",
              mainTitleFont=c(14,"bold.italic", "red"),
              xtitleFont=c(14,"bold", "blue"),
              ytitleFont=c(14,"bold", "blue"))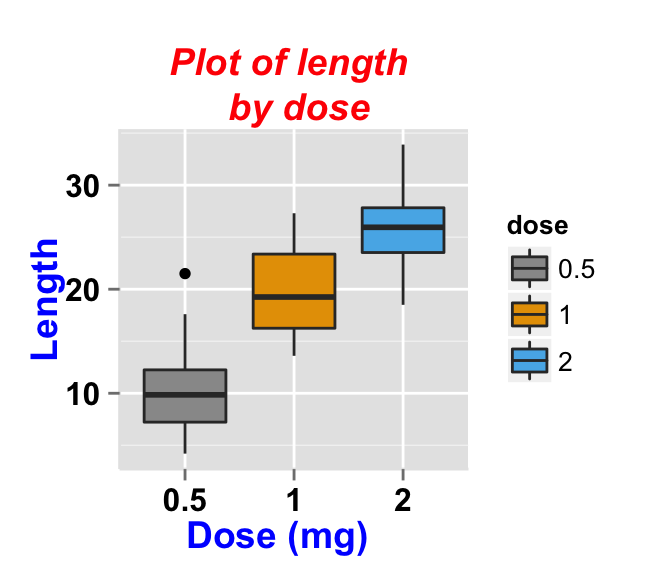
Note that the outputs of the two packages are the same, and easyGgplot2 is just a wrapper for ggplot2 package
Data visualizations
Click on the following articles to visualize your data using easyGgplot2 R package.
ggplot2.boxplot
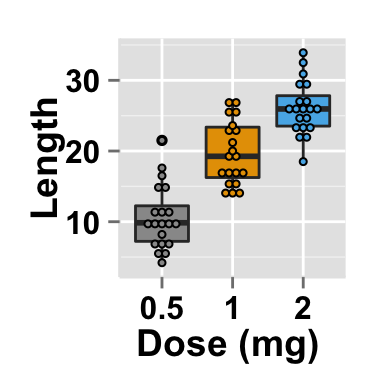 ggplot2.boxplot is an easy to use function from easyGgplot2 package to make and customize quickly a box plot using R software and ggplot2 plotting methods.
ggplot2.dotplot
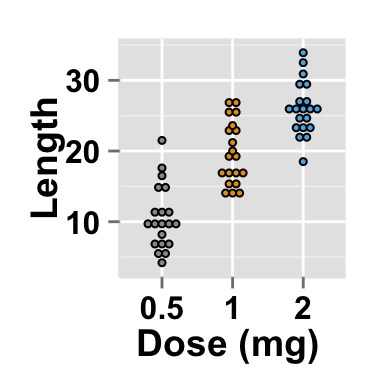 ggplot2.dotplot is an easy to use function from easyGgplot2 package to make and customize quickly a dot plot using R software and ggplot2 plotting methods.
ggplot2.violinplot
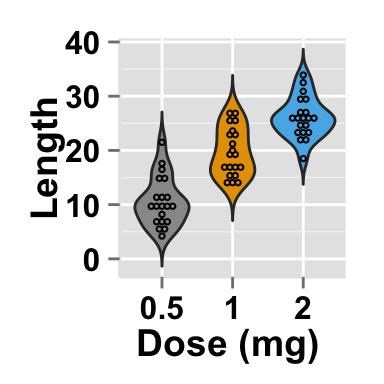 ggplot2.violinplot is an easy to use function from easyGgplot2 package to make and customize quickly a violin plot using R software and ggplot2 plotting methods.
ggplot2.stripchart
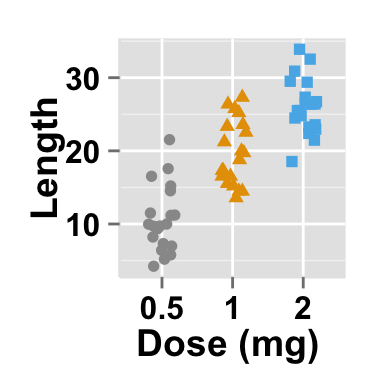 ggplot2.stripchart is an easy to use function from easyGgplot2 package to make and customize one dimensional scatter plots (or dot plots) using R software and ggplot2 package.
ggplot2.histogram
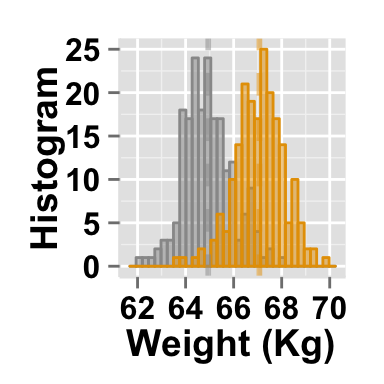 ggplot2.histogram is an easy to use function from easyGgplot2 package to make and customize quickly histogram using R software and ggplot2 plotting method.
ggplot2.density
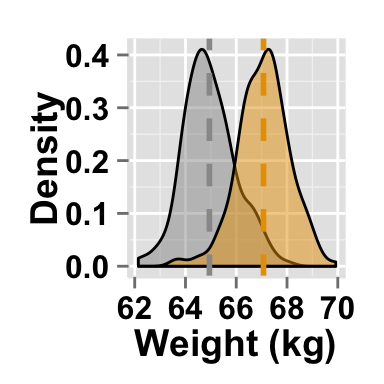 ggplot2.density is an easy to use function from easyGgplot2 package to make and customize quickly density curve using R software and ggplot2 package.
ggplot2.customize
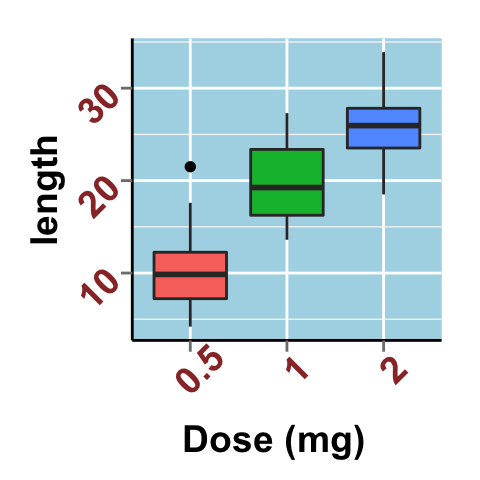 ggplot2.customize is an easy to use function from easyGgplot2 package to customize plots (e.g : box and whisker plot, histogram, density plot, etc, …) generated with R easyGgplot2 or ggplot2 package.
ggplot2.scatterplot
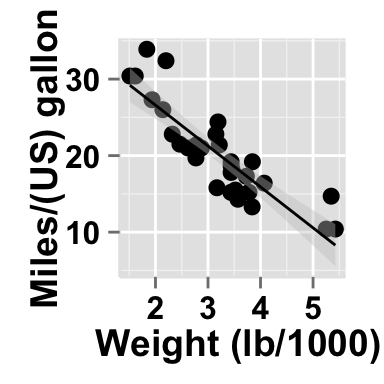 ggplot2.scatterplot is an easy to use function from easyGgplot2 package to make and customize quickly scatter plots using R software and ggplot2 package.
ggplot2.multiplot
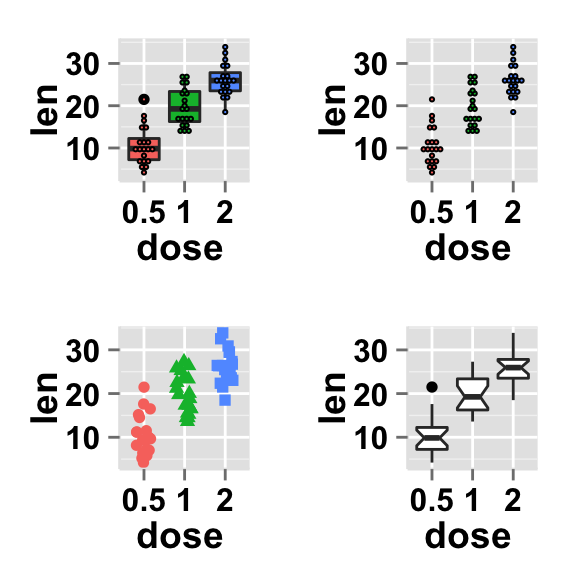 ggplot2.multiplot is a function, from easyGgplot2 package, to put multiple graphs on the same page.
ggplot2.lineplot
 ggplot2.lineplot is a function, from easyGgplot2 package, to easily draw and customize line plots.
ggplot2.barplot
 ggplot2.barplot is a function, from easyGgplot2 package, to easily draw and customize bar graphs using R software and ggplot2 plotting methods.
Easy ggplot2 ebook
Note that an eBook is available on easyGgplot2 package here.
By Alboukadel Kassambara
Copyright 2014 Alboukadel Kassambara. All rights reserved.
Published by STHDA (https://www.sthda.com/english).
September 2014 : First edition.
Licence : This document is under creative commons licence (http://creativecommons.org/licenses/by-nc-sa/3.0/).
Contact : Alboukadel Kassambara alboukadel.kassambara@gmail.com
Infos
This analysis was performed using R (ver. 3.1.0), easyGgplot2 (ver 1.0.0) and ggplot2 (ver 1.0.0).
Show me some love with the like buttons below... Thank you and please don't forget to share and comment below!!
Montrez-moi un peu d'amour avec les like ci-dessous ... Merci et n'oubliez pas, s'il vous plaît, de partager et de commenter ci-dessous!
Recommended for You!
Recommended for you
This section contains the best data science and self-development resources to help you on your path.
Books - Data Science
Our Books
- Practical Guide to Cluster Analysis in R by A. Kassambara (Datanovia)
- Practical Guide To Principal Component Methods in R by A. Kassambara (Datanovia)
- Machine Learning Essentials: Practical Guide in R by A. Kassambara (Datanovia)
- R Graphics Essentials for Great Data Visualization by A. Kassambara (Datanovia)
- GGPlot2 Essentials for Great Data Visualization in R by A. Kassambara (Datanovia)
- Network Analysis and Visualization in R by A. Kassambara (Datanovia)
- Practical Statistics in R for Comparing Groups: Numerical Variables by A. Kassambara (Datanovia)
- Inter-Rater Reliability Essentials: Practical Guide in R by A. Kassambara (Datanovia)
Others
- R for Data Science: Import, Tidy, Transform, Visualize, and Model Data by Hadley Wickham & Garrett Grolemund
- Hands-On Machine Learning with Scikit-Learn, Keras, and TensorFlow: Concepts, Tools, and Techniques to Build Intelligent Systems by Aurelien Géron
- Practical Statistics for Data Scientists: 50 Essential Concepts by Peter Bruce & Andrew Bruce
- Hands-On Programming with R: Write Your Own Functions And Simulations by Garrett Grolemund & Hadley Wickham
- An Introduction to Statistical Learning: with Applications in R by Gareth James et al.
- Deep Learning with R by François Chollet & J.J. Allaire
- Deep Learning with Python by François Chollet
Click to follow us on Facebook :
Comment this article by clicking on "Discussion" button (top-right position of this page)
Articles contained by this category :
ggplot2 boxplot : Easy box and whisker plots maker function
ggplot2 density : Easy density plot using ggplot2 and R statistical software
ggplot2 dot plot : Easy function for making a dot plot
ggplot2 histogram : Easy histogram graph with ggplot2 R package
ggplot2 violin plot : Easy function for data visualization using ggplot2 and R software
ggplot2.barplot : Easy bar graphs in R software using ggplot2
ggplot2.customize : How to personalize easily ggplot2 graphs in R statistical software
ggplot2.lineplot : Easy line plots in R software using ggplot2
ggplot2.multiplot : Put multiple graphs on the same page using ggplot2
ggplot2.scatterplot : Easy scatter plot using ggplot2 and R statistical software
ggplot2.stripchart : Easy one dimensional scatter plot using ggplot2 and R software


