correlation formula
Define correlation
Correlation is very helpful to investigate the dependence between two or more variables. As an example we are interested to know whether there is an association between the weights of fathers and son. correlation coefficient can be calculated to answer this question.
If there is no relationship between the two variables (father and son weights), the average weight of son should be the same regardless of the weight of the fathers and vice versa.
There are different methods to perform correlation analysis : Pearson, Kendall and Spearman correlation tests.
The most commonly used is Pearson correlation. The aim of this article is to describe Pearson correlation formula.
Pearson correlation
Pearson correlation measures a linear dependence between two variables (x and y). It’s also known as a parametric correlation test because it depends to the distribution of the data. The plot of y = f(x) is named linear regression curve.
The pearson correlation formula is :
\[ r = \frac{\sum{(x-m_x)(y-m_y)}}{\sqrt{\sum{(x-mx)^2}\sum{(y-my)^2}}} \]
\(m_x\) and \(m_y\) are the means of x and y variables.
the p-value (significance level) of the correlation can be determined :
by using the correlation coefficient table for the degrees of freedom : \(df = n-2\)
or by calculating the t value : \[ t=\frac{r}{\sqrt{1-r^2}}\sqrt{n-2} \]
In this case the corresponding p-value is determined using t distribution table for \(df = n-2\)
If the p-value is less than 5%, then the correlation is significant.
Interpretation of correlation coefficient
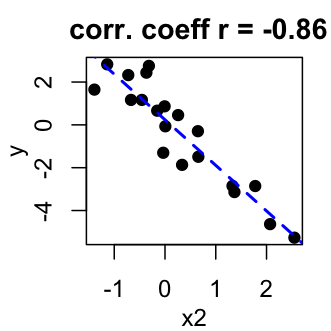
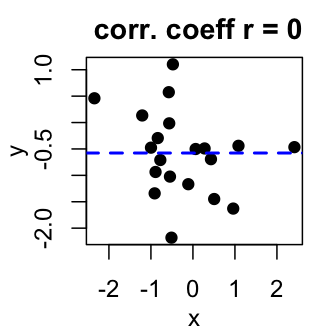
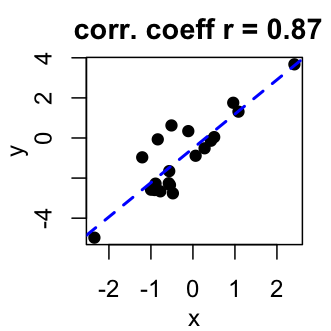
Correlation coefficient is between -1 (strong negative correlation) and 1 (strong positive correlation)


Correlation coefficient calculator
Show me some love with the like buttons below... Thank you and please don't forget to share and comment below!!
Montrez-moi un peu d'amour avec les like ci-dessous ... Merci et n'oubliez pas, s'il vous plaît, de partager et de commenter ci-dessous!
Recommended for You!
Recommended for you
This section contains the best data science and self-development resources to help you on your path.
Books - Data Science
Our Books
- Practical Guide to Cluster Analysis in R by A. Kassambara (Datanovia)
- Practical Guide To Principal Component Methods in R by A. Kassambara (Datanovia)
- Machine Learning Essentials: Practical Guide in R by A. Kassambara (Datanovia)
- R Graphics Essentials for Great Data Visualization by A. Kassambara (Datanovia)
- GGPlot2 Essentials for Great Data Visualization in R by A. Kassambara (Datanovia)
- Network Analysis and Visualization in R by A. Kassambara (Datanovia)
- Practical Statistics in R for Comparing Groups: Numerical Variables by A. Kassambara (Datanovia)
- Inter-Rater Reliability Essentials: Practical Guide in R by A. Kassambara (Datanovia)
Others
- R for Data Science: Import, Tidy, Transform, Visualize, and Model Data by Hadley Wickham & Garrett Grolemund
- Hands-On Machine Learning with Scikit-Learn, Keras, and TensorFlow: Concepts, Tools, and Techniques to Build Intelligent Systems by Aurelien Géron
- Practical Statistics for Data Scientists: 50 Essential Concepts by Peter Bruce & Andrew Bruce
- Hands-On Programming with R: Write Your Own Functions And Simulations by Garrett Grolemund & Hadley Wickham
- An Introduction to Statistical Learning: with Applications in R by Gareth James et al.
- Deep Learning with R by François Chollet & J.J. Allaire
- Deep Learning with Python by François Chollet
Click to follow us on Facebook :
Comment this article by clicking on "Discussion" button (top-right position of this page)


