Colors in R
In R, colors can be specified either by name (e.g col = “red”) or as a hexadecimal RGB triplet (such as col = “#FFCC00”). You can also use other color systems such as ones taken from the RColorBrewer package.
Built-in color names in R
We will use the following custom R function to generate a plot of color names available in R :
# Generate a plot of color names which R knows about.
#++++++++++++++++++++++++++++++++++++++++++++
# cl : a vector of colors to plots
# bg: background of the plot
# rot: text rotation angle
#usage=showCols(bg="gray33")
showCols <- function(cl=colors(), bg = "grey",
                     cex = 0.75, rot = 30) {
    m <- ceiling(sqrt(n <-length(cl)))
    length(cl) <- m*m; cm <- matrix(cl, m)
    require("grid")
    grid.newpage(); vp <- viewport(w = .92, h = .92)
    grid.rect(gp=gpar(fill=bg))
    grid.text(cm, x = col(cm)/m, y = rev(row(cm))/m, rot = rot,
              vp=vp, gp=gpar(cex = cex, col = cm))
  }
The names of the first sixty colors are shown in the following chart :
# The first sixty color names
showCols(bg="gray20",cl=colors()[1:60], rot=30, cex=0.9)
# Barplot using color names
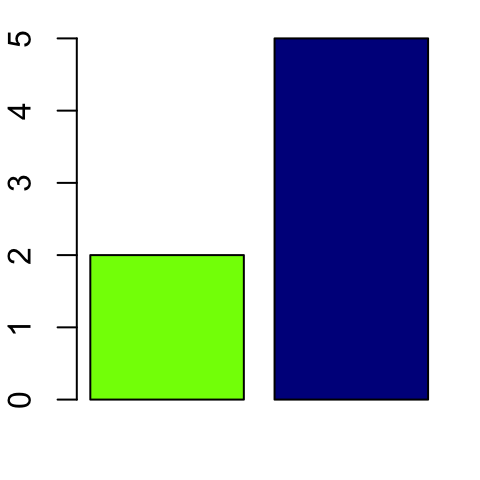
barplot(c(2,5), col=c("chartreuse", "blue4"))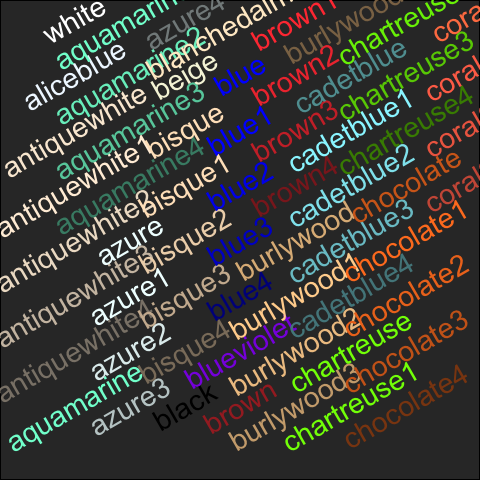
To view all the built-in color names which R knows about (n = 657), use the following R code :
showCols(cl= colors(), bg="gray33", rot=30, cex=0.75)Specifying colors by hexadecimal code
Colors can be specified using hexadecimal color code, such as “#FFC00”
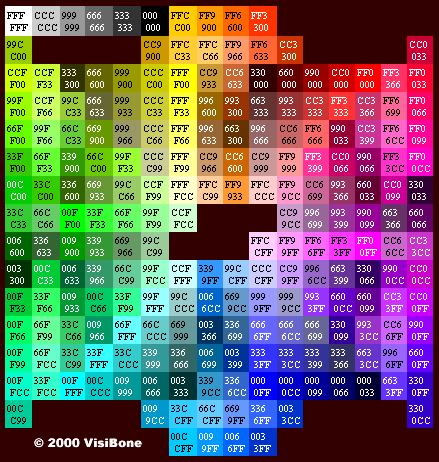 (Source: http://www.visibone.com)
# Barplot using hexadecimal color code
barplot(c(2,5), col=c("#009999", "#0000FF"))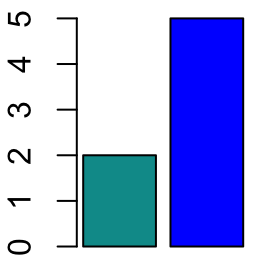
Using RColorBrewer palettes
You have to install the RColorBrewer package as follow :
install.packages("RColorBrewer")RColorBrewer package create a nice looking color palettes.
The color palettes associated to RColorBrewer package can be drawn using display.brewer.all() R function as follow :
library("RColorBrewer")
display.brewer.all()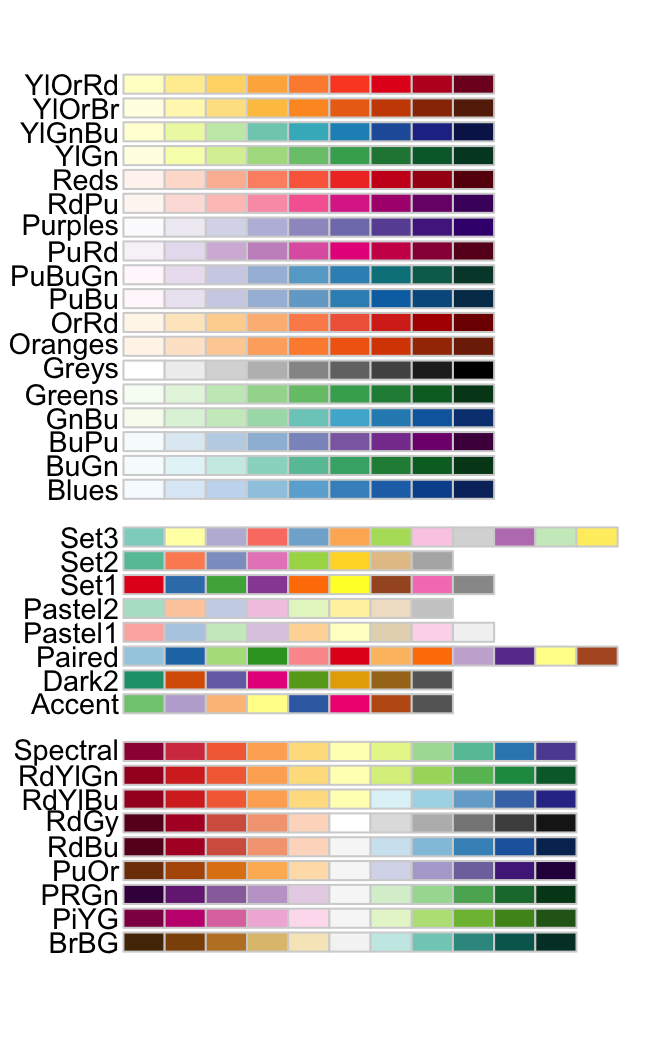
There are 3 types of palettes : sequential, diverging, and qualitative.
- Sequential palettes are suited to ordered data that progress from low to high (gradient). The palettes names are : Blues, BuGn, BuPu, GnBu, Greens, Greys, Oranges, OrRd, PuBu, PuBuGn, PuRd, Purples, RdPu, Reds, YlGn, YlGnBu YlOrBr, YlOrRd.
- Diverging palettes put equal emphasis on mid-range critical values and extremes at both ends of the data range. The diverging palettes are : BrBG, PiYG, PRGn, PuOr, RdBu, RdGy, RdYlBu, RdYlGn, Spectral
- Qualitative palettes are best suited to representing nominal or categorical data. They not imply magnitude differences between groups. The palettes names are : Accent, Dark2, Paired, Pastel1, Pastel2, Set1, Set2, Set3
You can also view a single RColorBrewer palette by specifying its name as follow :
# View a single RColorBrewer palette by specifying its name
display.brewer.pal(n = 8, name = 'RdBu')
# Hexadecimal color specification
brewer.pal(n = 8, name = "RdBu")
## [1] "#B2182B" "#D6604D" "#F4A582" "#FDDBC7" "#D1E5F0" "#92C5DE" "#4393C3" "#2166AC"# Barplot using RColorBrewer
barplot(c(2,5,7), col=brewer.pal(n = 3, name = "RdBu"))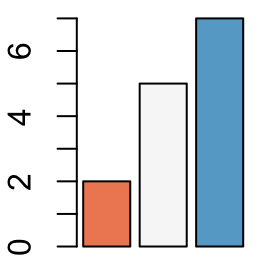
Use Wes Anderson color palettes
This color palettes can be installed and loaded as follow :
# Install
install.packages("wesanderson")
# Load
library(wesanderson)
The available color palettes are :


Use the palettes as follow :
# simple barplot
barplot(c(2,5,7), col=wes.palette(n=3, name="GrandBudapest"))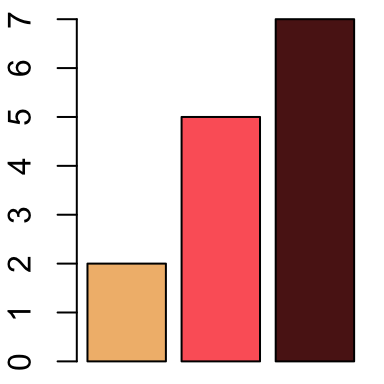
library(ggplot2)
ggplot(iris, aes(Sepal.Length, Sepal.Width, color = Species)) +
  geom_point(size = 2) +
  scale_color_manual(values = wes.palette(n=3, name="GrandBudapest"))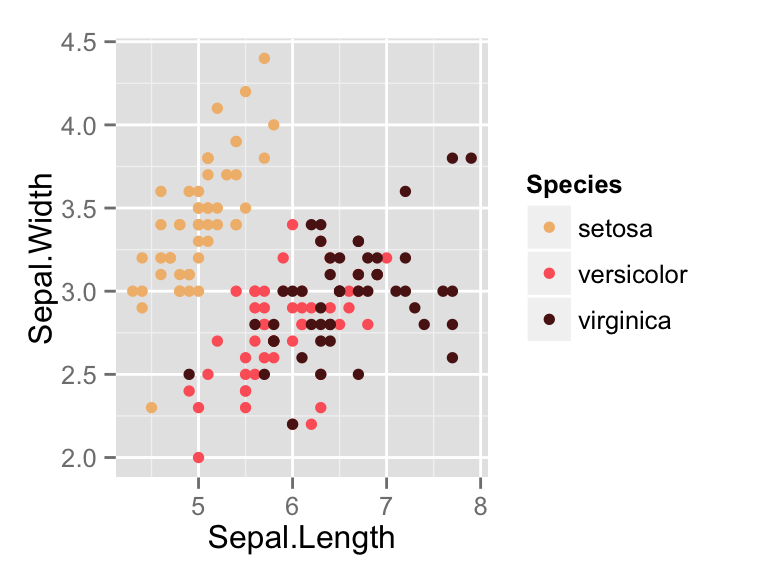
Create a vector of n contiguous colors
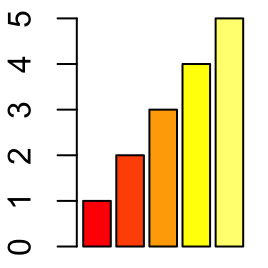
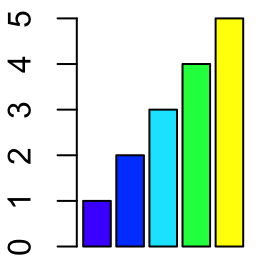
You can also generate a vector of n contiguous colors using the functions rainbow(n), heat.colors(n), terrain.colors(n), topo.colors(n), and cm.colors(n).
# Use rainbow colors
barplot(1:5, col=rainbow(5))
# Use heat.colors
barplot(1:5, col=heat.colors(5))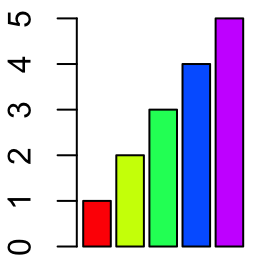
# Use terrain.colors
barplot(1:5, col=terrain.colors(5))
# Use topo.colors
barplot(1:5, col=topo.colors(5))
# Use cm.colors
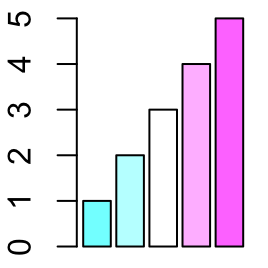
barplot(1:5, col=cm.colors(5))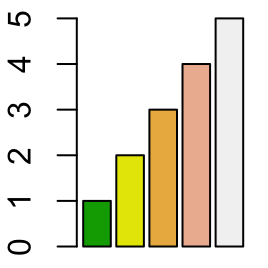
Infos
This analysis has been performed using R (ver. 3.1.0).Show me some love with the like buttons below... Thank you and please don't forget to share and comment below!!
Montrez-moi un peu d'amour avec les like ci-dessous ... Merci et n'oubliez pas, s'il vous plaît, de partager et de commenter ci-dessous!
Recommended for You!
Recommended for you
This section contains the best data science and self-development resources to help you on your path.
Books - Data Science
Our Books
- Practical Guide to Cluster Analysis in R by A. Kassambara (Datanovia)
- Practical Guide To Principal Component Methods in R by A. Kassambara (Datanovia)
- Machine Learning Essentials: Practical Guide in R by A. Kassambara (Datanovia)
- R Graphics Essentials for Great Data Visualization by A. Kassambara (Datanovia)
- GGPlot2 Essentials for Great Data Visualization in R by A. Kassambara (Datanovia)
- Network Analysis and Visualization in R by A. Kassambara (Datanovia)
- Practical Statistics in R for Comparing Groups: Numerical Variables by A. Kassambara (Datanovia)
- Inter-Rater Reliability Essentials: Practical Guide in R by A. Kassambara (Datanovia)
Others
- R for Data Science: Import, Tidy, Transform, Visualize, and Model Data by Hadley Wickham & Garrett Grolemund
- Hands-On Machine Learning with Scikit-Learn, Keras, and TensorFlow: Concepts, Tools, and Techniques to Build Intelligent Systems by Aurelien Géron
- Practical Statistics for Data Scientists: 50 Essential Concepts by Peter Bruce & Andrew Bruce
- Hands-On Programming with R: Write Your Own Functions And Simulations by Garrett Grolemund & Hadley Wickham
- An Introduction to Statistical Learning: with Applications in R by Gareth James et al.
- Deep Learning with R by François Chollet & J.J. Allaire
- Deep Learning with Python by François Chollet
Click to follow us on Facebook :
Comment this article by clicking on "Discussion" button (top-right position of this page)


