ggplot2.multiplot : Put multiple graphs on the same page using ggplot2
Introduction
ggplot2.multiplot is an easy to use function to put multiple graphs on the same page using R statistical software and ggplot2 plotting methods. This function is from easyGgplot2 package.
Install and load easyGgplot2 package
easyGgplot2 R package can be installed as follow :
install.packages("devtools")
library(devtools)
install_github("easyGgplot2", "kassambara")
Load the package using this R code :
library(easyGgplot2)Examples
# data.frame
df <- ToothGrowth
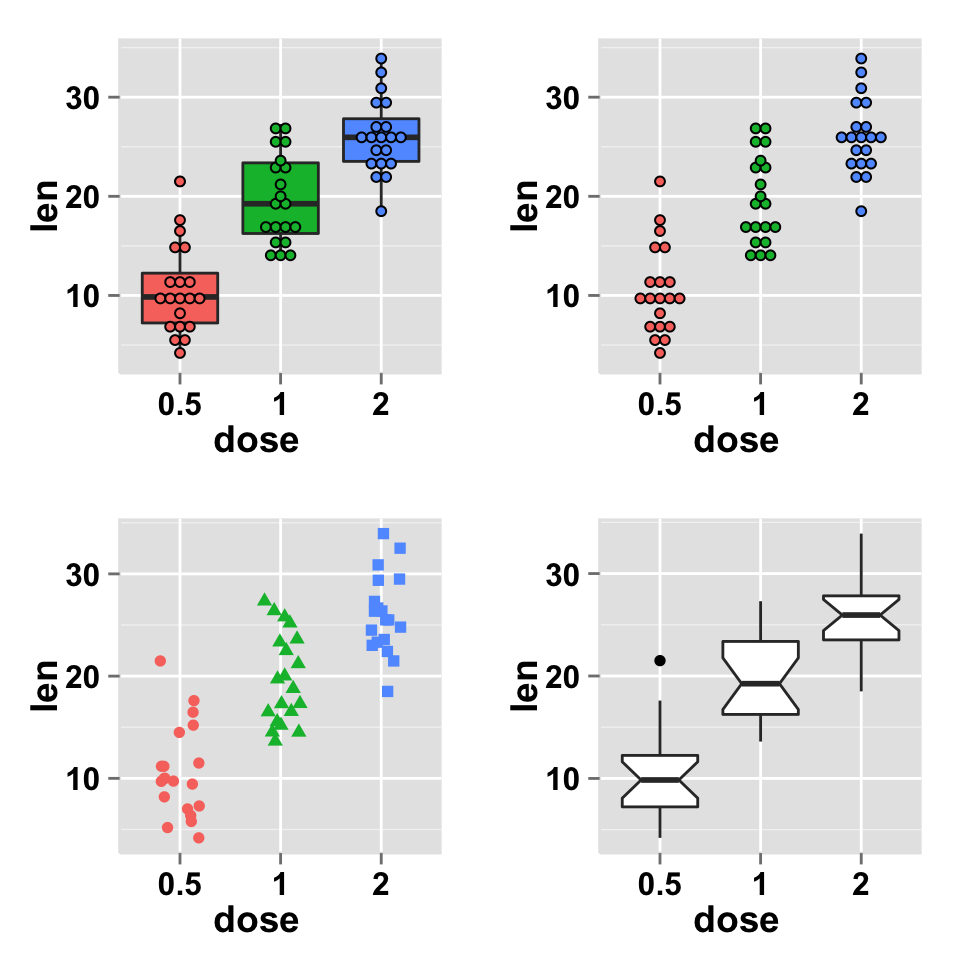
# Custom box plot with centered dot plot
plot1<-ggplot2.boxplot(data=df, xName='dose',yName='len',
                groupName='dose',
                addDot=TRUE, dotSize=1, showLegend=FALSE)
# Custom dot plot with centered dot plot
plot2<-ggplot2.dotplot(data=df, xName='dose',yName='len',
                groupName='dose',showLegend=FALSE)
# Custom strip chart with centered dot plot
plot3<-ggplot2.stripchart(data=df, xName='dose',yName='len',
                      groupName='dose', showLegend=FALSE)
# Notched box plot
plot4<-ggplot2.boxplot(data=df, xName='dose',yName='len',
                notch=TRUE)
# Multiple graphs on the same page
ggplot2.multiplot(plot1,plot2,plot3,plot4, cols=2)
ggplot2.multiplot function
Description
Put multiple graphs on the same page
usage
library(easyGgplot2)
ggplot2.multiplot(..., plotlist=NULL, cols=2)
Arguments
| Arguments | Descriptions |
|---|---|
| …, plotList | List of ggplot2 objects separated by a comma. (e.g: plot1, plot2, plot3) |
| cols | Number of columns in layout |
Easy ggplot2 ebook
Note that an eBook is available on easyGgplot2 package here.
By Alboukadel Kassambara
Copyright 2014 Alboukadel Kassambara. All rights reserved.
Published by STHDA (https://www.sthda.com/english).
September 2014 : First edition.
Licence : This document is under creative commons licence (http://creativecommons.org/licenses/by-nc-sa/3.0/).
Contact : Alboukadel Kassambara alboukadel.kassambara@gmail.com
Infos
This analysis was performed using R (ver. 3.1.0), easyGgplot2 (ver 1.0.0) and ggplot2 (ver 1.0.0).
Show me some love with the like buttons below... Thank you and please don't forget to share and comment below!!
Montrez-moi un peu d'amour avec les like ci-dessous ... Merci et n'oubliez pas, s'il vous plaît, de partager et de commenter ci-dessous!
Recommended for You!
Recommended for you
This section contains the best data science and self-development resources to help you on your path.
Books - Data Science
Our Books
- Practical Guide to Cluster Analysis in R by A. Kassambara (Datanovia)
- Practical Guide To Principal Component Methods in R by A. Kassambara (Datanovia)
- Machine Learning Essentials: Practical Guide in R by A. Kassambara (Datanovia)
- R Graphics Essentials for Great Data Visualization by A. Kassambara (Datanovia)
- GGPlot2 Essentials for Great Data Visualization in R by A. Kassambara (Datanovia)
- Network Analysis and Visualization in R by A. Kassambara (Datanovia)
- Practical Statistics in R for Comparing Groups: Numerical Variables by A. Kassambara (Datanovia)
- Inter-Rater Reliability Essentials: Practical Guide in R by A. Kassambara (Datanovia)
Others
- R for Data Science: Import, Tidy, Transform, Visualize, and Model Data by Hadley Wickham & Garrett Grolemund
- Hands-On Machine Learning with Scikit-Learn, Keras, and TensorFlow: Concepts, Tools, and Techniques to Build Intelligent Systems by Aurelien Géron
- Practical Statistics for Data Scientists: 50 Essential Concepts by Peter Bruce & Andrew Bruce
- Hands-On Programming with R: Write Your Own Functions And Simulations by Garrett Grolemund & Hadley Wickham
- An Introduction to Statistical Learning: with Applications in R by Gareth James et al.
- Deep Learning with R by François Chollet & J.J. Allaire
- Deep Learning with Python by François Chollet
Click to follow us on Facebook :
Comment this article by clicking on "Discussion" button (top-right position of this page)


