factoextra: Reduce overplotting of points and labels - R software and data mining
To reduce overplotting, the argument jitter is used in the functions fviz_pca_xx(), fviz_ca_xx() and fviz_mca_xx() available in the R package factoextra.
The argument jitter is a list containing the parameters what, width and height (i.e jitter = list(what, width, height)):
- what: the element to be jittered. Possible values are “point” or “p”; “label” or “l”; “both” or “b”.
- width: degree of jitter in x direction
- height: degree of jitter in y direction
Some examples of usage are described in the next sections.
Install required packages
- FactoMineR: for computing PCA (Principal Component Analysis), CA (Correspondence Analysis) and MCA (Multiple Correspondence Analysis)
- factoextra: for the visualization of FactoMineR results
FactoMineR and factoextra R packages can be installed as follow :
install.packages("FactoMineR")
# install.packages("devtools")
devtools::install_github("kassambara/factoextra")
Note that, for factoextra a version >= 1.0.3 is required for using the argument jitter. If it’s already installed on your computer, you should re-install it to have the most updated version.
Load FactoMineR and factoextra
library("FactoMineR")
library("factoextra")
Multiple Correspondence Analysis (MCA)
# Load data
data(poison)
poison.active <- poison[1:55, 5:15]
# Compute MCA
res.mca <- MCA(poison.active, graph = FALSE)
# Default plot
fviz_mca_ind(res.mca)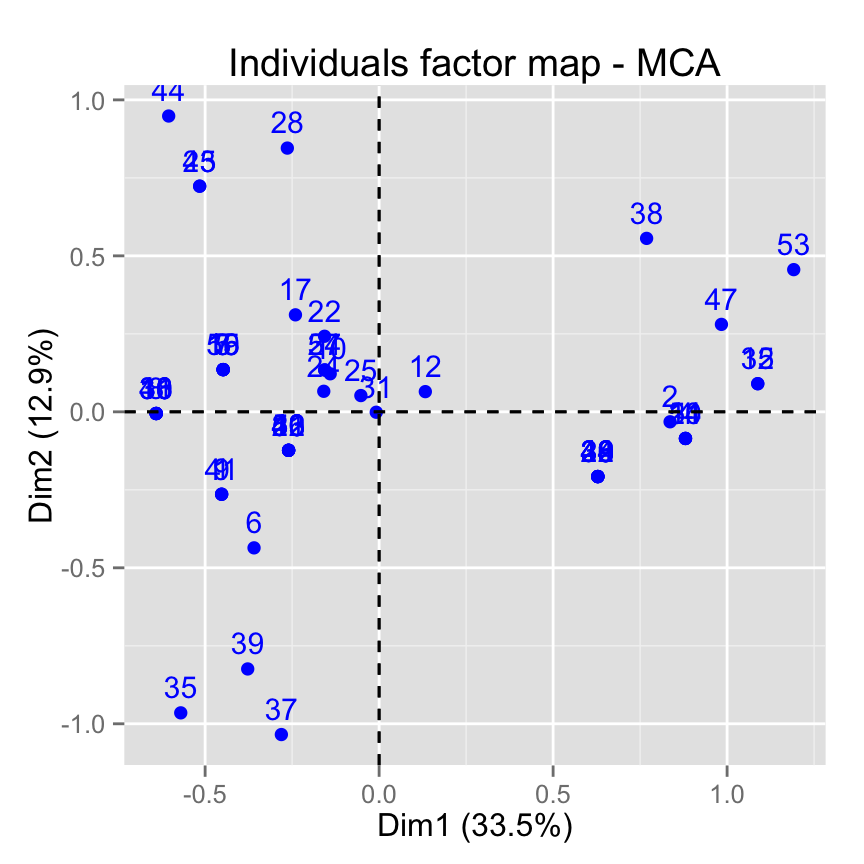
# Use jitter to reduce overplotting.
# Only labels are jittered
fviz_mca_ind(res.mca, jitter = list(what = "label",
                                    width = 0.1, height = 0.15))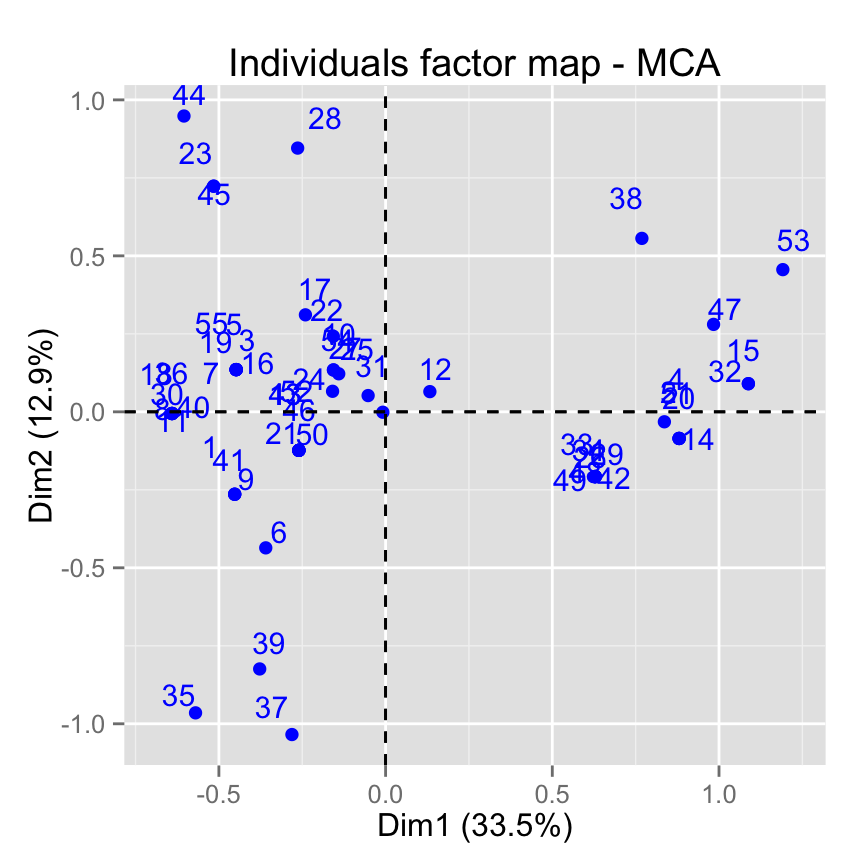
# Jitter both points and labels
fviz_mca_ind(res.mca, jitter = list(what = "both",
                                    width = 0.1, height = 0.15))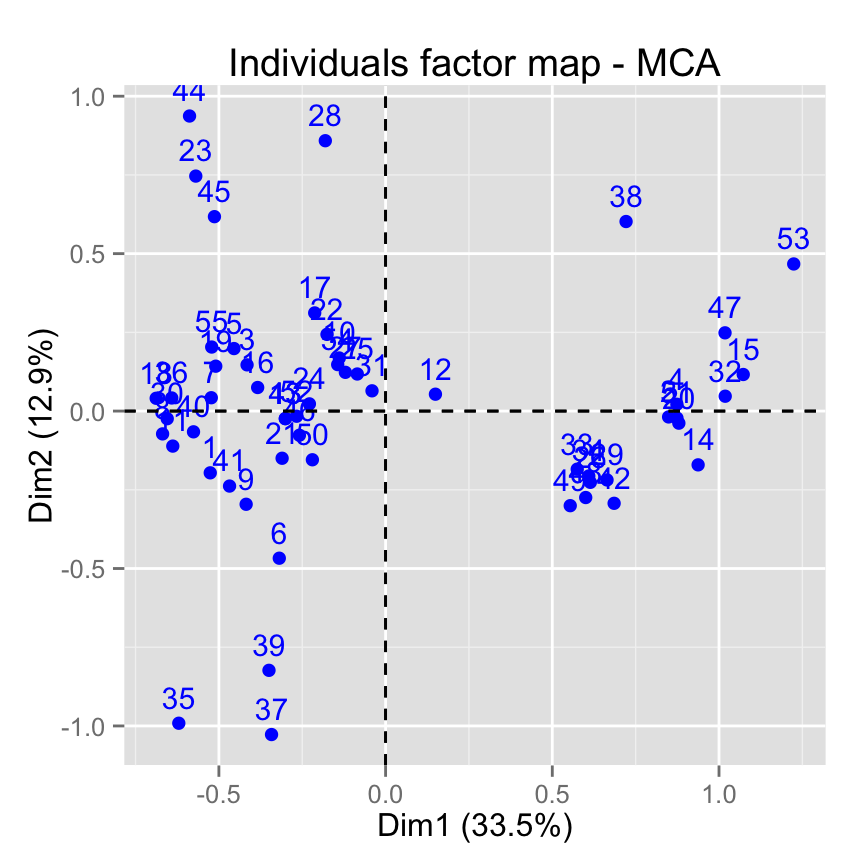
Simple Correspondence Analysis (CA)
# Load data
data("housetasks")
# Compute CA
res.ca <- CA(housetasks, graph = FALSE)
# Default biplot
fviz_ca_biplot(res.ca)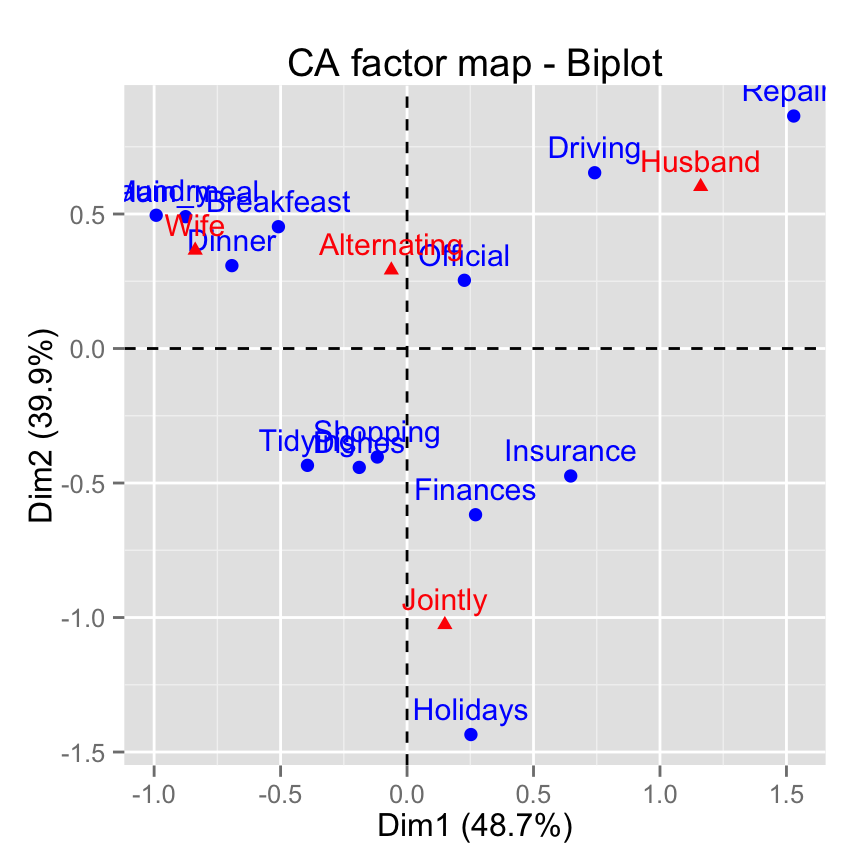
# Jitter in y direction
fviz_ca_biplot(res.ca, jitter = list(what = "label",
                                     width = 0.4, height = 0.3))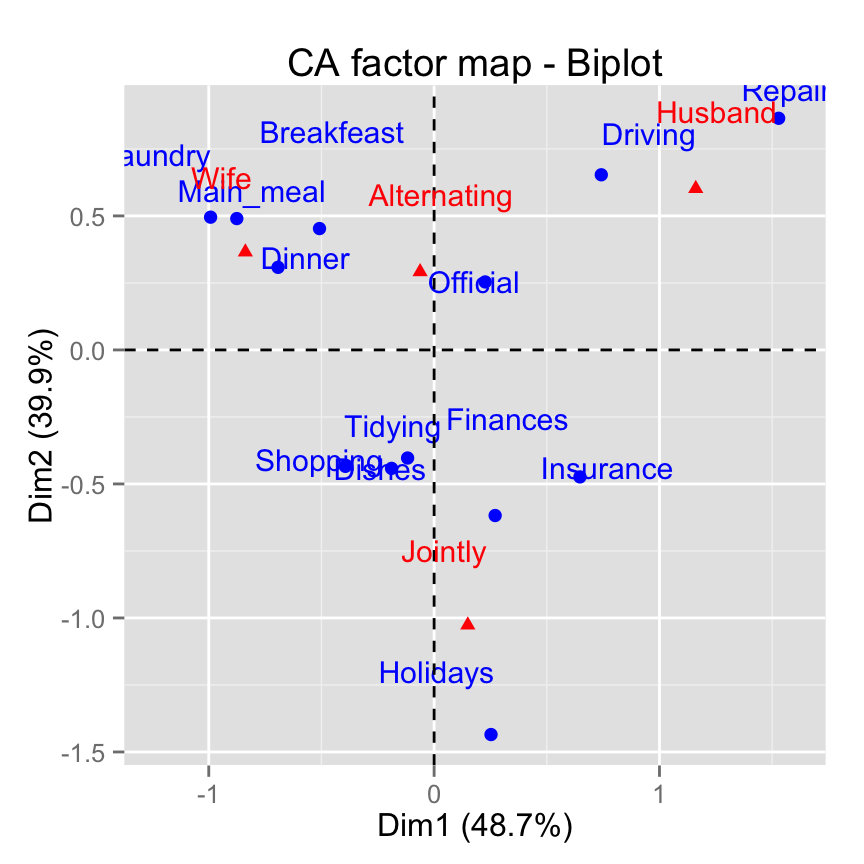
Principal Componet Analysis (PCA)
# Load data
data(decathlon2)
decathlon2.active <- decathlon2[1:23, 1:10]
# Compute PCA
res.pca <- PCA(decathlon2.active, graph = FALSE)
# Default biplot
fviz_pca_ind(res.pca)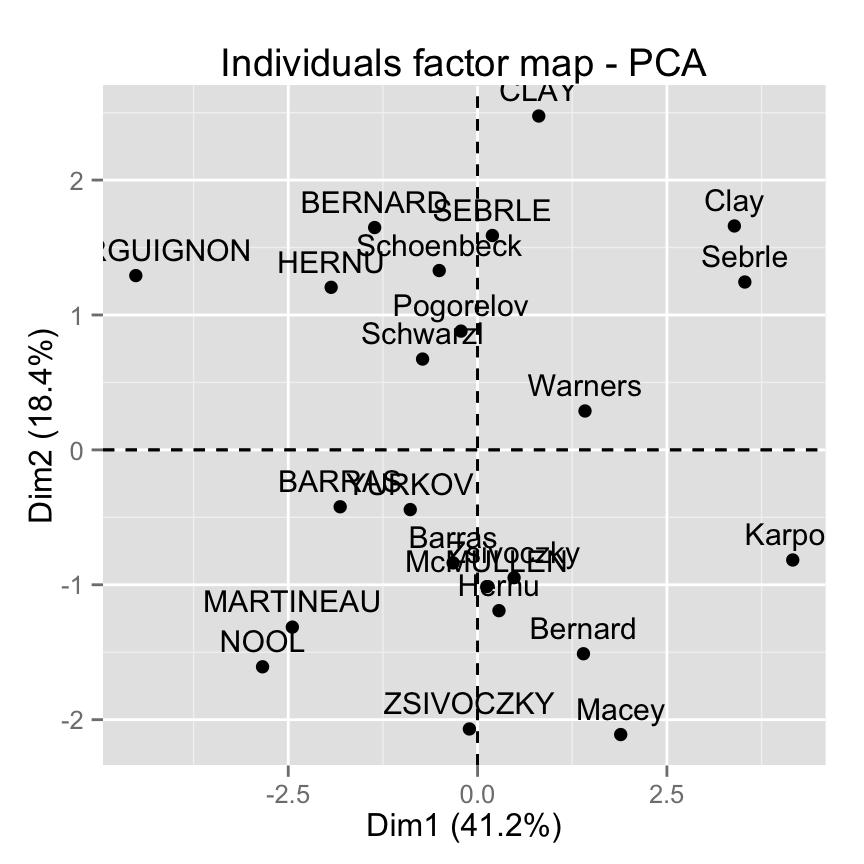
# Use jitter in x and y direction
fviz_pca_ind(res.pca, jitter = list(what = "label",
                                    width = 0.6, height = 0.6))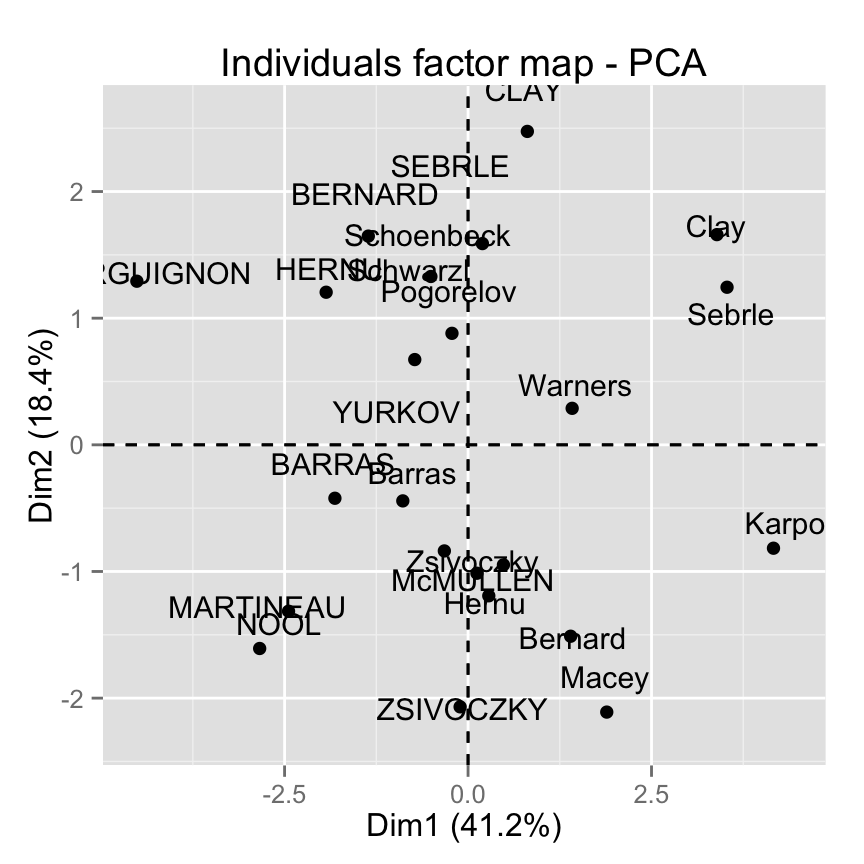
Infos
This analysis has been performed using R software (ver. 3.2.1), FactoMineR (ver. 1.30) and factoextra (ver. 1.0.2)
Show me some love with the like buttons below... Thank you and please don't forget to share and comment below!!
Montrez-moi un peu d'amour avec les like ci-dessous ... Merci et n'oubliez pas, s'il vous plaît, de partager et de commenter ci-dessous!
Recommended for You!
Recommended for you
This section contains the best data science and self-development resources to help you on your path.
Books - Data Science
Our Books
- Practical Guide to Cluster Analysis in R by A. Kassambara (Datanovia)
- Practical Guide To Principal Component Methods in R by A. Kassambara (Datanovia)
- Machine Learning Essentials: Practical Guide in R by A. Kassambara (Datanovia)
- R Graphics Essentials for Great Data Visualization by A. Kassambara (Datanovia)
- GGPlot2 Essentials for Great Data Visualization in R by A. Kassambara (Datanovia)
- Network Analysis and Visualization in R by A. Kassambara (Datanovia)
- Practical Statistics in R for Comparing Groups: Numerical Variables by A. Kassambara (Datanovia)
- Inter-Rater Reliability Essentials: Practical Guide in R by A. Kassambara (Datanovia)
Others
- R for Data Science: Import, Tidy, Transform, Visualize, and Model Data by Hadley Wickham & Garrett Grolemund
- Hands-On Machine Learning with Scikit-Learn, Keras, and TensorFlow: Concepts, Tools, and Techniques to Build Intelligent Systems by Aurelien Géron
- Practical Statistics for Data Scientists: 50 Essential Concepts by Peter Bruce & Andrew Bruce
- Hands-On Programming with R: Write Your Own Functions And Simulations by Garrett Grolemund & Hadley Wickham
- An Introduction to Statistical Learning: with Applications in R by Gareth James et al.
- Deep Learning with R by François Chollet & J.J. Allaire
- Deep Learning with Python by François Chollet
Click to follow us on Facebook :
Comment this article by clicking on "Discussion" button (top-right position of this page)


