This tutorial describes how to compute and add new variables to a data frame in R. You will learn the following R functions from the dplyr R package:
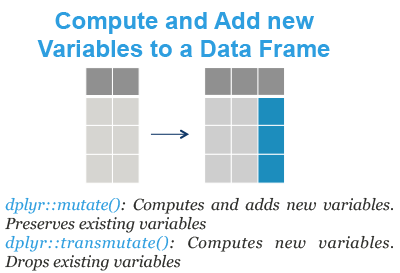
- mutate(): compute and add new variables into a data table. It preserves existing variables.
- transmute(): compute new columns but drop existing variables.
We’ll also present three variants of mutate() and transmute() to modify multiple columns at once:
- mutate_all() / transmute_all(): apply a function to every columns in the data frame.
- mutate_at() / transmute_at(): apply a function to specific columns selected with a character vector
- mutate_if() / transmute_if(): apply a function to columns selected with a predicate function that returns TRUE.
Contents:
Required packages
Load the tidyverse packages, which include dplyr:
library(tidyverse)Demo dataset
We’ll use the R built-in iris data set, which we start by converting into a tibble data frame (tbl_df) for easier data analysis.
my_data <- as_tibble(iris)
my_data
## # A tibble: 150 x 5
## Sepal.Length Sepal.Width Petal.Length Petal.Width Species
## <dbl> <dbl> <dbl> <dbl> <fct>
## 1 5.1 3.5 1.4 0.2 setosa
## 2 4.9 3 1.4 0.2 setosa
## 3 4.7 3.2 1.3 0.2 setosa
## 4 4.6 3.1 1.5 0.2 setosa
## 5 5 3.6 1.4 0.2 setosa
## 6 5.4 3.9 1.7 0.4 setosa
## # ... with 144 more rowsmutate: Add new variables by preserving existing ones
Add new columns (sepal_by_petal_*) by preserving existing ones:
my_data %>%
  mutate(sepal_by_petal_l = Sepal.Length/Petal.Length)
## # A tibble: 150 x 6
## Sepal.Length Sepal.Width Petal.Length Petal.Width Species
## <dbl> <dbl> <dbl> <dbl> <fct>
## 1 5.1 3.5 1.4 0.2 setosa
## 2 4.9 3 1.4 0.2 setosa
## 3 4.7 3.2 1.3 0.2 setosa
## 4 4.6 3.1 1.5 0.2 setosa
## 5 5 3.6 1.4 0.2 setosa
## 6 5.4 3.9 1.7 0.4 setosa
## # ... with 144 more rows, and 1 more variable: sepal_by_petal_l <dbl>transmute: Make new variables by dropping existing ones
Add new columns (sepal_by_petal_*) by dropping existing ones:
my_data %>%
  transmute(
    sepal_by_petal_l = Sepal.Length/Petal.Length,
    sepal_by_petal_w = Sepal.Width/Petal.Width
    )
## # A tibble: 150 x 2
## sepal_by_petal_l sepal_by_petal_w
## <dbl> <dbl>
## 1 3.64 17.5
## 2 3.5 15
## 3 3.62 16
## 4 3.07 15.5
## 5 3.57 18
## 6 3.18 9.75
## # ... with 144 more rowsModify multiple columns at once
We start by creating a demo data set, my_data2, which contains only numeric columns. To do so, we’ll remove the column Species as follow:
my_data2 <- my_data %>%
  select(-Species)
The functions mutate_all() / transmute_all(), mutate_at() / transmute_at() and mutate_if() / transmute_if() can be used to modify multiple columns at once.
The simplified formats are as follow:
# Mutate variants
mutate_all(.tbl, .funs, ...)
mutate_if(.tbl, .predicate, .funs, ...)
mutate_at(.tbl, .vars, .funs, ...)

# Transmute variants
transmute_all(.tbl, .funs, ...)
transmute_if(.tbl, .predicate, .funs, ...)
transmute_at(.tbl, .vars, .funs, ...)- .tbl: a tbl data frame
- .funs: List of function calls generated by
funs(), or a character vector of function names, or simply a function. - …: Additional arguments for the function calls in .funs.
- .predicate: A predicate function to be applied to the columns or a logical vector. The variables for which .predicate is or returns TRUE are selected.
In the following sections, we’ll present only the variants of mutate(). The transmute() variants can be used similarly.
Transform all column values
- Divide all columns value by 2.54:
my_data2 %>%
  mutate_all(funs(./2.54))
## # A tibble: 150 x 4
## Sepal.Length Sepal.Width Petal.Length Petal.Width
## <dbl> <dbl> <dbl> <dbl>
## 1 2.01 1.38 0.551 0.0787
## 2 1.93 1.18 0.551 0.0787
## 3 1.85 1.26 0.512 0.0787
## 4 1.81 1.22 0.591 0.0787
## 5 1.97 1.42 0.551 0.0787
## 6 2.13 1.54 0.669 0.157
## # ... with 144 more rowsNote that, the dot “.” represents any variables
- Function names will be appended to column names if
.funshas names or multiple inputs:
my_data2 %>%
  mutate_all(funs(cm = ./2.54))
## # A tibble: 150 x 8
## Sepal.Length Sepal.Width Petal.Length Petal.Width Sepal.Length_cm
## <dbl> <dbl> <dbl> <dbl> <dbl>
## 1 5.1 3.5 1.4 0.2 2.01
## 2 4.9 3 1.4 0.2 1.93
## 3 4.7 3.2 1.3 0.2 1.85
## 4 4.6 3.1 1.5 0.2 1.81
## 5 5 3.6 1.4 0.2 1.97
## 6 5.4 3.9 1.7 0.4 2.13
## # ... with 144 more rows, and 3 more variables: Sepal.Width_cm <dbl>,
## # Petal.Length_cm <dbl>, Petal.Width_cm <dbl>Note that, the output variable name now includes the function name.
Transform specific columns
- mutate_at(): transform specific columns selected by names:
my_data2 %>%
  mutate_at(
    c("Sepal.Length", "Petal.Width"),
    funs(cm = ./2.54)
)- mutate_if(): transform specific columns selected by a predicate function.
mutate_if() is particularly useful for transforming variables from one type to another.
my_data %>% mutate_if(is.factor, as.character)Round all numeric variables:
my_data %>% mutate_if(is.numeric, round, digits = 0)Summary
This article describe how to add new variable columns into a data frame using the dplyr functions: mutate(), transmute() and variants.
mutate(iris, sepal = 2*Sepal.Length): Computes and appends new variable(s).transmute(iris, sepal = 2*Sepal.Length): Makes new variable(s) and drops existing ones.
Recommended for you
This section contains best data science and self-development resources to help you on your path.
Coursera - Online Courses and Specialization
Data science
- Course: Machine Learning: Master the Fundamentals by Stanford
- Specialization: Data Science by Johns Hopkins University
- Specialization: Python for Everybody by University of Michigan
- Courses: Build Skills for a Top Job in any Industry by Coursera
- Specialization: Master Machine Learning Fundamentals by University of Washington
- Specialization: Statistics with R by Duke University
- Specialization: Software Development in R by Johns Hopkins University
- Specialization: Genomic Data Science by Johns Hopkins University
Popular Courses Launched in 2020
- Google IT Automation with Python by Google
- AI for Medicine by deeplearning.ai
- Epidemiology in Public Health Practice by Johns Hopkins University
- AWS Fundamentals by Amazon Web Services
Trending Courses
- The Science of Well-Being by Yale University
- Google IT Support Professional by Google
- Python for Everybody by University of Michigan
- IBM Data Science Professional Certificate by IBM
- Business Foundations by University of Pennsylvania
- Introduction to Psychology by Yale University
- Excel Skills for Business by Macquarie University
- Psychological First Aid by Johns Hopkins University
- Graphic Design by Cal Arts
Amazon FBA
Amazing Selling Machine
Books - Data Science
Our Books
- Practical Guide to Cluster Analysis in R by A. Kassambara (Datanovia)
- Practical Guide To Principal Component Methods in R by A. Kassambara (Datanovia)
- Machine Learning Essentials: Practical Guide in R by A. Kassambara (Datanovia)
- R Graphics Essentials for Great Data Visualization by A. Kassambara (Datanovia)
- GGPlot2 Essentials for Great Data Visualization in R by A. Kassambara (Datanovia)
- Network Analysis and Visualization in R by A. Kassambara (Datanovia)
- Practical Statistics in R for Comparing Groups: Numerical Variables by A. Kassambara (Datanovia)
- Inter-Rater Reliability Essentials: Practical Guide in R by A. Kassambara (Datanovia)
Others
- R for Data Science: Import, Tidy, Transform, Visualize, and Model Data by Hadley Wickham & Garrett Grolemund
- Hands-On Machine Learning with Scikit-Learn, Keras, and TensorFlow: Concepts, Tools, and Techniques to Build Intelligent Systems by Aurelien Géron
- Practical Statistics for Data Scientists: 50 Essential Concepts by Peter Bruce & Andrew Bruce
- Hands-On Programming with R: Write Your Own Functions And Simulations by Garrett Grolemund & Hadley Wickham
- An Introduction to Statistical Learning: with Applications in R by Gareth James et al.
- Deep Learning with R by François Chollet & J.J. Allaire
- Deep Learning with Python by François Chollet

The new columns seem to be only virtual. For example, I cannot apply the rename function. Or when I write the dataframe as csv, the new column isn’t present.
How can I force the variable to persist?
It’s not virtual, you need to create a new R object to hold the modified data frame; then, you can save or manipulate the data again.
For example:
Many thanks!
I realize I was struggling to understand the pipe concept.
Hello,
I am pretty new to R…
I created a new column var (all_bis) using mutate () to add to existing ones to my database (roma_obs) . The new var is the difference between two vars (see code below). I could not use the rename () function as I did not really understand its use (perhaps it is needed in case I want to replace a var rather than adding a new one?).
I need to save the new column var (all_bis) to either the existing (roma_obs) or a new database (roma_obs_bis) in excel (would be better the first solution). However I have problems with your code lines at this step. I used the write_xls () for excel files…without success (Error in is.data.frame(x) : object “roma_obs_bis” not found).
Do you have suggestions how to overwrite existing db in Excel with the new one including the new var??
roma_obs_bis %
mutate(all_bis = roma_obs$all – roma_obs$all_0_30) %>%
rename(all = all_bis) # NOT SURE
write_xlsx(roma_obs_bis, path = tempfile(fileext = ‘…\roma_obs_bis.xlsx’)) # NOT SURE
Thank you very much for your help
Hello, I get the error message “could not find function “%>%”” when I try to run the code. I’ve installed the packages mentioned and I’m rather new to R so I don’t know how to solve the problem. Could anyone help?
Normally, you just need to load the tidyverse package.
The function `%>%` is available in the magrittr package, which is automatically loaded by tidyverse.
Please, try this:
isn’t transmute() rather than transmutate()?
yes it is, fixed now, thanks!!
Hi ,
How can i sort a column after piping?
For example :
Code : { aggregate(df[, c(3)], list(Region = df$Region), mean) %>%
left_join(count(df, “Region”)) }
I get :
Region x freq
1 Australia and New Zealand 7.298000 2
2 Central and Eastern Europe 5.469448 29
3 Eastern Asia 5.672000 6
4 Latin America and Caribbean 5.950136 22
5 Middle East and Northern Africa 5.294158 19
6 North America 7.107000 2
…
> now i want to sort x descending .. i tried :
{ “%>%
sort( x, decreasing = TRUE) }
and get error : Error in do.call(“order”, c(z, list(na.last = na.last, decreasing = decreasing, :
object ‘x’ not found
How can i sort the output of piping ?
Thnaks !! :]
Try the function arrange() [in dplyr package].
Read more at: https://www.datanovia.com/en/lessons/reorder-data-frame-rows-in-r/