CLARA (Clustering Large Applications, (Kaufman and Rousseeuw 1990)) is an extension to k-medoids (PAM) methods to deal with data containing a large number of objects (more than several thousand observations) in order to reduce computing time and RAM storage problem. This is achieved using the sampling approach.
In this article, you will learn:
- The basic steps of CLARA algorithm
- Examples of computingCLARA in R software using practical examples
Contents:
Related Book
Practical Guide to Cluster Analysis in RCLARA concept
Instead of finding medoids for the entire data set, CLARA considers a small sample of the data with fixed size (sampsize) and applies the PAM algorithm to generate an optimal set of medoids for the sample. The quality of resulting medoids is measured by the average dissimilarity between every object in the entire data set and the medoid of its cluster, defined as the cost function.
CLARA repeats the sampling and clustering processes a pre-specified number of times in order to minimize the sampling bias. The final clustering results correspond to the set of medoids with the minimal cost. The CLARA algorithm is summarized in the next section.
CLARA Algorithm
The algorithm is as follow:
- Create randomly, from the original dataset, multiple subsets with fixed size (sampsize)
- Compute PAM algorithm on each subset and choose the corresponding k representative objects (medoids). Assign each observation of the entire data set to the closest medoid.
- Calculate the mean (or the sum) of the dissimilarities of the observations to their closest medoid. This is used as a measure of the goodness of the clustering.
- Retain the sub-dataset for which the mean (or sum) is minimal. A further analysis is carried out on the final partition.
Note that, each sub-data set is forced to contain the medoids obtained from the best sub-data set until then. Randomly drawn observations are added to this set until sampsize has been reached.
Computing CLARA in R
Data format and preparation
To compute the CLARA algorithm in R, the data should be prepared as indicated in Chapter data preparation and R packages.
Here, we’ll generate use a random data set. To make the result reproducible, we start by using the function set.seed().
set.seed(1234)
# Generate 500 objects, divided into 2 clusters.
df <- rbind(cbind(rnorm(200,0,8), rnorm(200,0,8)),
           cbind(rnorm(300,50,8), rnorm(300,50,8)))

# Specify column and row names
colnames(df) <- c("x", "y")
rownames(df) <- paste0("S", 1:nrow(df))

# Previewing the data
head(df, nrow = 6)
## x y
## S1 -9.66 3.88
## S2 2.22 5.57
## S3 8.68 1.48
## S4 -18.77 5.61
## S5 3.43 2.49
## S6 4.05 6.08Required R packages and functions
The function clara() [cluster package] can be used to compute CLARA. The simplified format is as follow:
clara(x, k, metric = "euclidean", stand = FALSE,
samples = 5, pamLike = FALSE)- x: a numeric data matrix or data frame, each row corresponds to an observation, and each column corresponds to a variable. Missing values (NAs) are allowed.
- k: the number of clusters.
- metric: the distance metrics to be used. Available options are “euclidean” and “manhattan”. Euclidean distances are root sum-of-squares of differences, and manhattan distances are the sum of absolute differences. Read more on distance measures (Chapter ). Note that, manhattan distance is less sensitive to outliers.
- stand: logical value; if true, the variables (columns) in x are standardized before calculating the dissimilarities. Note that, it’s recommended to standardize variables before clustering.
- samples: number of samples to be drawn from the data set. Default value is 5 but it’s recommended a much larger value.
- pamLike: logical indicating if the same algorithm in the pam() function should be used. This should be always true.
To create a beautiful graph of the clusters generated with the pam() function, will use the factoextra package.
- Installing required packages:
install.packages(c("cluster", "factoextra"))- Loading the packages:
library(cluster)
library(factoextra)
Estimating the optimal number of clusters
To estimate the optimal number of clusters in your data, it’s possible to use the average silhouette method as described in PAM clustering chapter (Chapter @ref(k-medoids)). The R function fviz_nbclust() [factoextra package] provides a solution to facilitate this step.
Claim Your Membership Now.
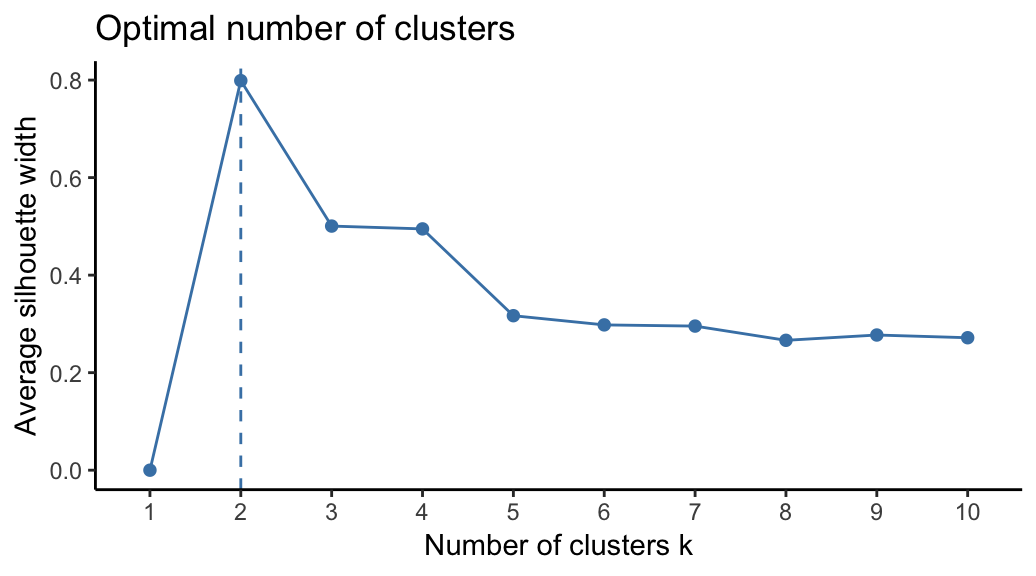
From the plot, the suggested number of clusters is 2. In the next section, we’ll classify the observations into 2 clusters.
Computing CLARA
The R code below computes PAM algorithm with k = 2:
# Compute CLARA
clara.res <- clara(df, 2, samples = 50, pamLike = TRUE)

# Print components of clara.res
print(clara.res)
## Call: clara(x = df, k = 2, samples = 50, pamLike = TRUE)
## Medoids:
## x y
## S121 -1.53 1.15
## S455 48.36 50.23
## Objective function: 9.88
## Clustering vector: Named int [1:500] 1 1 1 1 1 1 1 1 1 1 1 1 1 1 1 1 1 1 ...
## - attr(*, "names")= chr [1:500] "S1" "S2" "S3" "S4" "S5" "S6" "S7" ...
## Cluster sizes: 200 300
## Best sample:
## [1] S37 S49 S54 S63 S68 S71 S76 S80 S82 S101 S103 S108 S109 S118
## [15] S121 S128 S132 S138 S144 S162 S203 S210 S216 S231 S234 S249 S260 S261
## [29] S286 S299 S304 S305 S312 S315 S322 S350 S403 S450 S454 S455 S456 S465
## [43] S488 S497
##
## Available components:
## [1] "sample" "medoids" "i.med" "clustering" "objective"
## [6] "clusinfo" "diss" "call" "silinfo" "data"The output of the function clara() includes the following components:
- medoids: Objects that represent clusters
- clustering: a vector containing the cluster number of each object
- sample: labels or case numbers of the observations in the best sample, that is, the sample used by the clara algorithm for the final partition.
If you want to add the point classifications to the original data, use this:
dd <- cbind(df, cluster = clara.res$cluster)
head(dd, n = 4)
## x y cluster
## S1 -9.66 3.88 1
## S2 2.22 5.57 1
## S3 8.68 1.48 1
## S4 -18.77 5.61 1You can access to the results returned by clara() as follow:
# Medoids
clara.res$medoids
## x y
## S121 -1.53 1.15
## S455 48.36 50.23# Clustering
head(clara.res$clustering, 10)## S1 S2 S3 S4 S5 S6 S7 S8 S9 S10
## 1 1 1 1 1 1 1 1 1 1The medoids are S121, S455
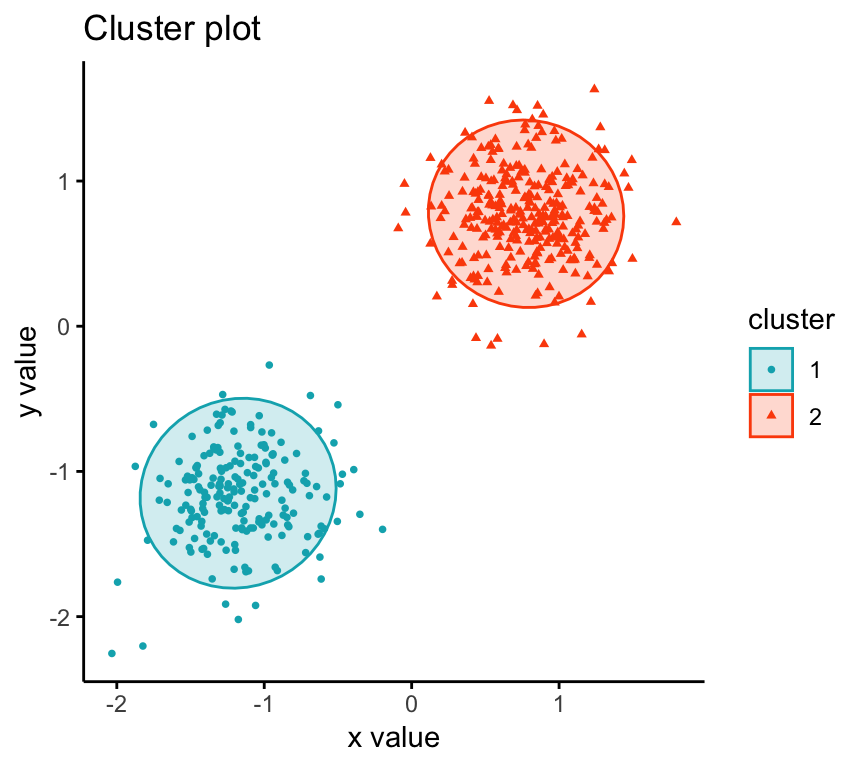
Visualizing CLARA clusters
To visualize the partitioning results, we’ll use the function fviz_cluster() [factoextra package]. It draws a scatter plot of data points colored by cluster numbers.
Claim Your Membership Now.
Summary
The CLARA (Clustering Large Applications) algorithm is an extension to the PAM (Partitioning Around Medoids) clustering method for large data sets. It intended to reduce the computation time in the case of large data set.
As almost all partitioning algorithm, it requires the user to specify the appropriate number of clusters to be produced. This can be estimated using the function fviz_nbclust [in factoextra R package].
The R function clara() [cluster package] can be used to compute CLARA algorithm. The simplified format is clara(x, k, pamLike = TRUE), where “x” is the data and k is the number of clusters to be generated.
After, computing CLARA, the R function fviz_cluster() [factoextra package] can be used to visualize the results. The format is fviz_cluster(clara.res), where clara.res is the CLARA results.
References
Kaufman, Leonard, and Peter Rousseeuw. 1990. Finding Groups in Data: An Introduction to Cluster Analysis.
Recommended for you
This section contains best data science and self-development resources to help you on your path.
Coursera - Online Courses and Specialization
Data science
- Course: Machine Learning: Master the Fundamentals by Stanford
- Specialization: Data Science by Johns Hopkins University
- Specialization: Python for Everybody by University of Michigan
- Courses: Build Skills for a Top Job in any Industry by Coursera
- Specialization: Master Machine Learning Fundamentals by University of Washington
- Specialization: Statistics with R by Duke University
- Specialization: Software Development in R by Johns Hopkins University
- Specialization: Genomic Data Science by Johns Hopkins University
Popular Courses Launched in 2020
- Google IT Automation with Python by Google
- AI for Medicine by deeplearning.ai
- Epidemiology in Public Health Practice by Johns Hopkins University
- AWS Fundamentals by Amazon Web Services
Trending Courses
- The Science of Well-Being by Yale University
- Google IT Support Professional by Google
- Python for Everybody by University of Michigan
- IBM Data Science Professional Certificate by IBM
- Business Foundations by University of Pennsylvania
- Introduction to Psychology by Yale University
- Excel Skills for Business by Macquarie University
- Psychological First Aid by Johns Hopkins University
- Graphic Design by Cal Arts
Amazon FBA
Amazing Selling Machine
Books - Data Science
Our Books
- Practical Guide to Cluster Analysis in R by A. Kassambara (Datanovia)
- Practical Guide To Principal Component Methods in R by A. Kassambara (Datanovia)
- Machine Learning Essentials: Practical Guide in R by A. Kassambara (Datanovia)
- R Graphics Essentials for Great Data Visualization by A. Kassambara (Datanovia)
- GGPlot2 Essentials for Great Data Visualization in R by A. Kassambara (Datanovia)
- Network Analysis and Visualization in R by A. Kassambara (Datanovia)
- Practical Statistics in R for Comparing Groups: Numerical Variables by A. Kassambara (Datanovia)
- Inter-Rater Reliability Essentials: Practical Guide in R by A. Kassambara (Datanovia)
Others
- R for Data Science: Import, Tidy, Transform, Visualize, and Model Data by Hadley Wickham & Garrett Grolemund
- Hands-On Machine Learning with Scikit-Learn, Keras, and TensorFlow: Concepts, Tools, and Techniques to Build Intelligent Systems by Aurelien Géron
- Practical Statistics for Data Scientists: 50 Essential Concepts by Peter Bruce & Andrew Bruce
- Hands-On Programming with R: Write Your Own Functions And Simulations by Garrett Grolemund & Hadley Wickham
- An Introduction to Statistical Learning: with Applications in R by Gareth James et al.
- Deep Learning with R by François Chollet & J.J. Allaire
- Deep Learning with Python by François Chollet

Hi !
I would appreciatte your help for indicating:
1) if CLARA algorithm can be applied with categorical, binary and numeric columns.
2) How can I get the optimal number of clusters if my dataset has categorical, binary and numeric columns
Thanks in advance !
Javier
Javier, yes you can use this with mixed data types. CLARA is based on PAM (aka k-medoids) methods. The difference is that in traditional k-medoids methods the algorithm is applied to the whole data set at once. CLARA applies the algorithm to many samples of the data set. This technique is done when you have a large dataset because the algorithm is too computationally-intensive to handle datasets above a certain size.
Dear all,
thank you for the nice post. My question is the following:
– I have large datset (100000 obs and 20 numerical and 2 categorical variables).
-I need to cluster these observations based on the 22 variables, I have no idea how many clusters/groups I need to indicate in clara(). I guess I have to produce trees with clara() with different number of clusters and compare them.
-> the main quesitons is: based on which factor/value do I compare the different produced trees and select one?
Best regards
Aöessandro
Hello !
Is it possible to apply CLARA algorithm to a pre-computed dissimilarity matrix ?
(PAM function in R can be applied to a dissimilarity matrix when parameter diss = TRUE)
Best regards,
Jules
cluster::clara() does not support a dissimilarity matrix as input
Dear ALL
I have noticed a significant variability in the silhouette index when I change the default value for samples (5
default value) and sampsize (40+2*clusters number) in CLARA.
Is there somes rules according to the number of cluster and observations to fix samples and sampsize parameters efficiently, so as to avoid under- and oversampling with CLARA in one hand and keeping a good time running in other hand ?
Best regards,
Jack
Dear all, please I would like to know if it is possible to define segments myself using the clara. For example, If I want to segment the data by age group, income groups or by customerType. Is that possible using Clara? Thank you in advance for your reply.